

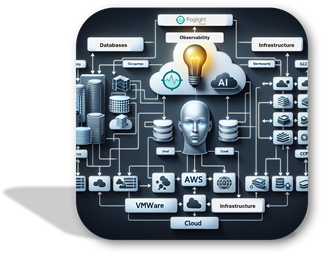
Over the years, Foglight evolved as a Data Observability Platform for multiple databases, Hybrid and Cloud infrastructures. In the rapidly evolving world of IT monitoring and observability, Open Telemetry has emerged as a game-changer. It provides a set of APIs, libraries, agents, and instrumentation to collect and export telemetry data (metrics, logs, and traces) from your applications.
Foglight, as a leading observability and diagnostics solution, has integrated Open Telemetry to enhance its capabilities. This blog post explores the benefits and features of this integration.
Why Foglight Embraces Open Telemetry
Foglight has integrated Open Telemetry to provide a more robust and flexible observability solution. Foglight currently provides database global view and query insights data to be exported via an OpenTelemetry-compatible API. Here are some reasons why Foglight users should be excited about this integration:
- Enhanced Visibility: With Open Telemetry, Foglight provides more granular and comprehensive telemetry data, offering deeper insights into application performance and behavior.
- Interoperability: Open Telemetry's standardized approach ensures that telemetry data can be easily integrated with other monitoring and observability tools, enhancing Foglight's interoperability.
- Future-Proofing: By adopting Open Telemetry, Foglight ensures that it stays ahead of the curve in terms of industry standards and best practices for observability.
Foglight's Open Telemetry Metrics also expands to multiple database types (yes its a long list  )
)
- Amazon Redshift
- Amazon Redis
- Azure SQL Database
- DB2
- MongoDB
- MySQL
- PostgreSQL
- Oracle
- Snowflake
- SAP HANA
- SAP (Sybase ASE)
- SQL Server
- More to come
What are the list of metrics that can be exported:
Database Global View Data : These metrics provide comprehensive insights into the performance and health of your databases and systems
- Total Health of the instance
- Database Health Status
- System Health
- Database Uptime: The time since the database was last up (in milliseconds).
- Instance Workload
- CPU Utilization
- Memory Utilization
- Disk Utilization
- Warning, Critical, Fatal Alarms: Total number of severity alarms for the instance
- Host Warning, Critical, Fatal Alarms: Total number of severity alarms for the host
Query insight Data: These metrics help in identifying queries that are causing significant performance issues and prioritize
- Instance Impact: Percentage Impact by a single query of the total instance workload
- Execution: Total number of times a query was executed
- Execution Time: The total time taken to execute a query.
- Elapsed Time: The total time consumed for carrying out query execution
- Response Time: The average response time taken to execute a query (in milliseconds)
For more information - Click here https://docs.foglight.com/integratingfoglight/opentelemetry/
Stay tuned, In my next blog - I will share steps on how to leverage Foglight’s Open Telemetry in other tools!