

Why move from v.5 or v. 6? ....because 7.1!
For a detailed list and explanation of what is new in Foglight v. 7.1, please refer to the Foglight v. 7.1 Release Notes
....but here are some highlights....
User Interface Enhancements:
Breadcrumb: Larger, easier to read.

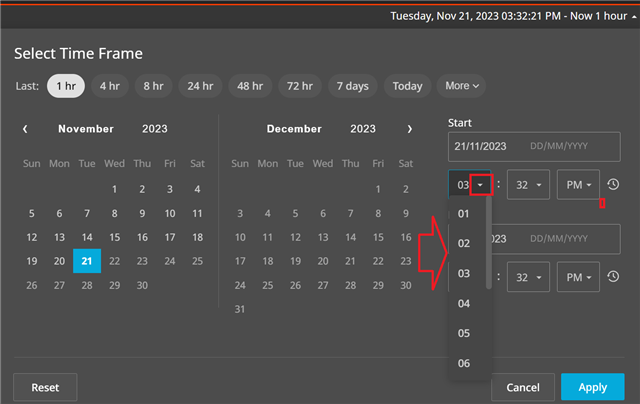
Time Frame Selector: Larger, easier to read, dropdown option
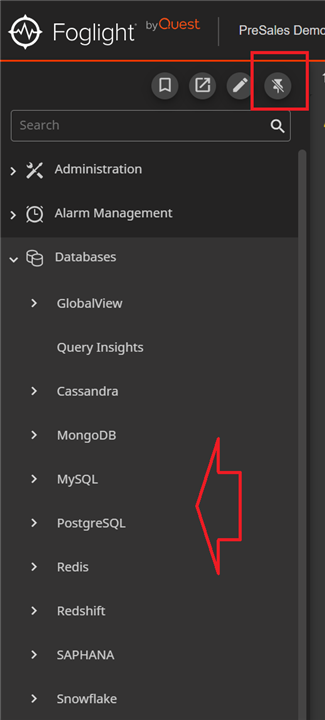
All Databases are now accessible from the Global View
Updated Pin location
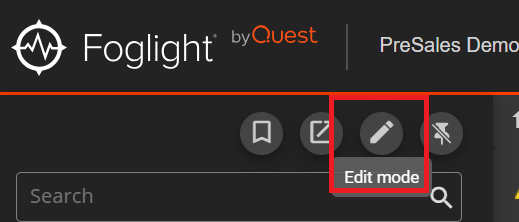
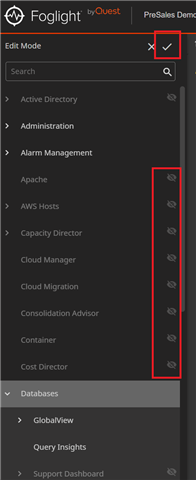
*Pro Tip:
Use EDIT MODE to hide selections you don't need for a simpler, clutter-free look.
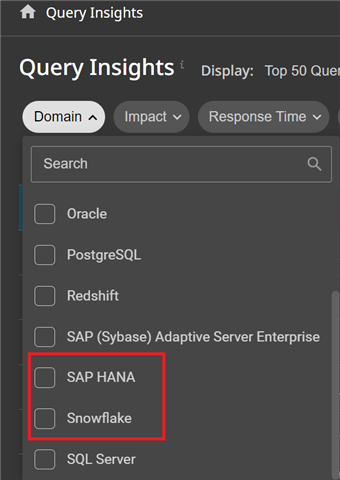
Query Insights dashboard updates:
- Snowflake & SAP HANA added (only Cassandra is not supported – by design)
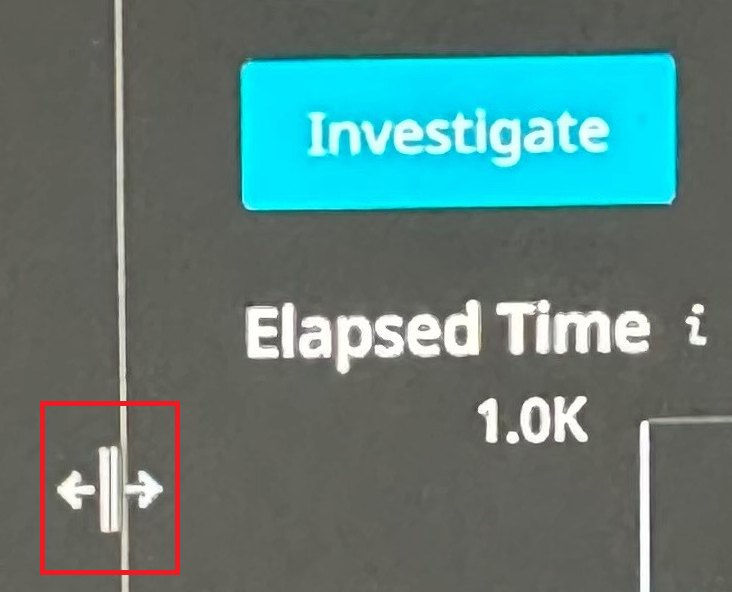
- Can resize Query Insights sections
- Save customer filter selection when navigating back to Query Insights
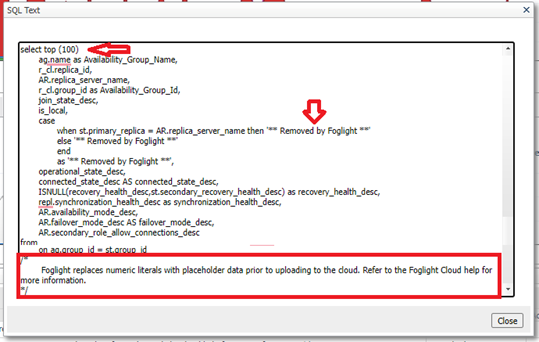
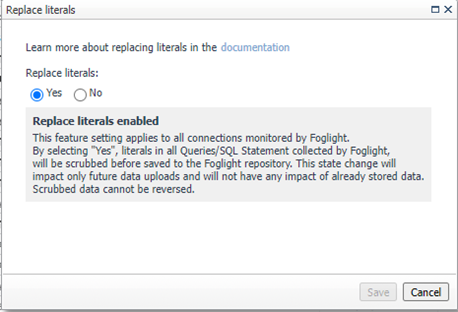
Replace Literals: Scrubs strings and numbers
Why - String and numeric literals may contain sensitive or Personally Identifiable Information (PII).
When - At collection time and before uploading or presenting the data to Foglight
Where – Performance Investigator, Top SQL, Execution Plan, etc.
How -
- Affects all strings and/or numbers within a statement
- Replaces strings, any string, within quoted characters, with *Replaced by Foglight*
- Replaces numbers with 1 followed by zeros and add a note at the bottom to indicate the action
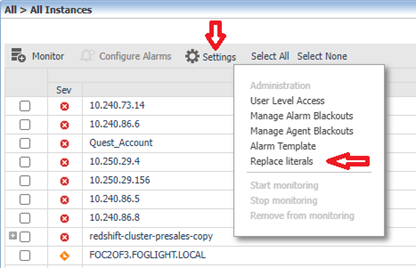
Set in the Global View
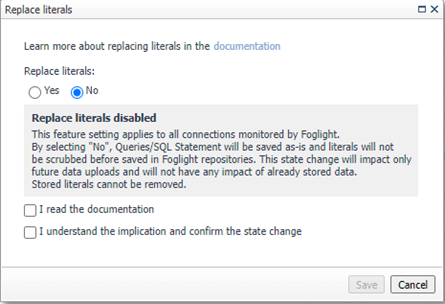
Change state will present a warning message:
Set to Yes –
- Data will be scrubbed with no option to restore the stored data in the future
Set to No –
- Literal will be uploaded with no option to remove already stored information
- Require the user to confirm that scrub data is now off
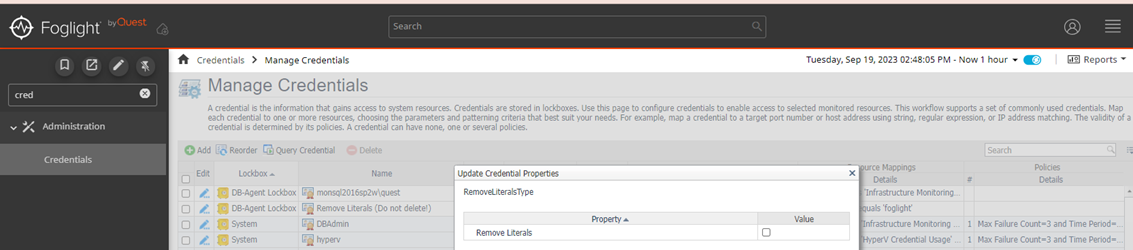
Uses lockbox credential as a global parameter to control Replace Literals setting
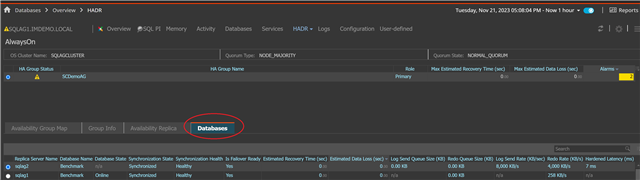
SQL Server Always On Availability Groups dashboard updates:
- Added baseline calculation for Estimated time for failover (RTO) and Potential data loss (RPO)
- Always on dashboard reorganized. Tabular view instead of popup window
- New metrics reflecting data transfer lags added to Availability Group → Databases tab
- New charts reflecting data transfer lags added to Availability Group → Databases tab
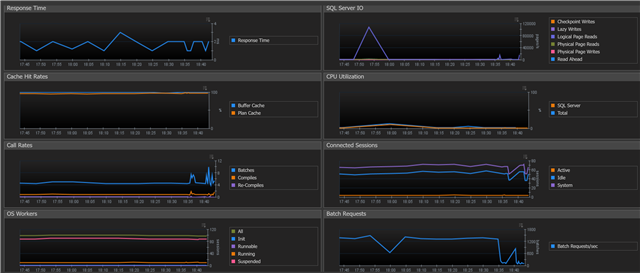
Two new charts added to Activity → Instance Summary dashboard
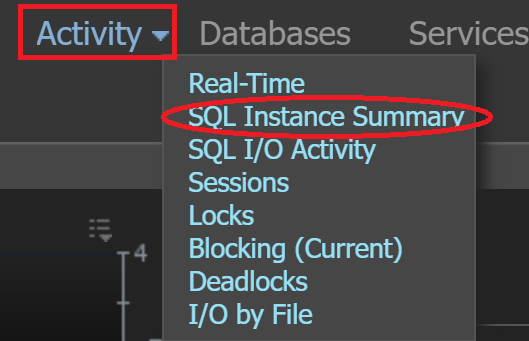
- OS Workers: Count of OS workers by state
- Batch Requests: Batch requests rate (Batch Request/sec)
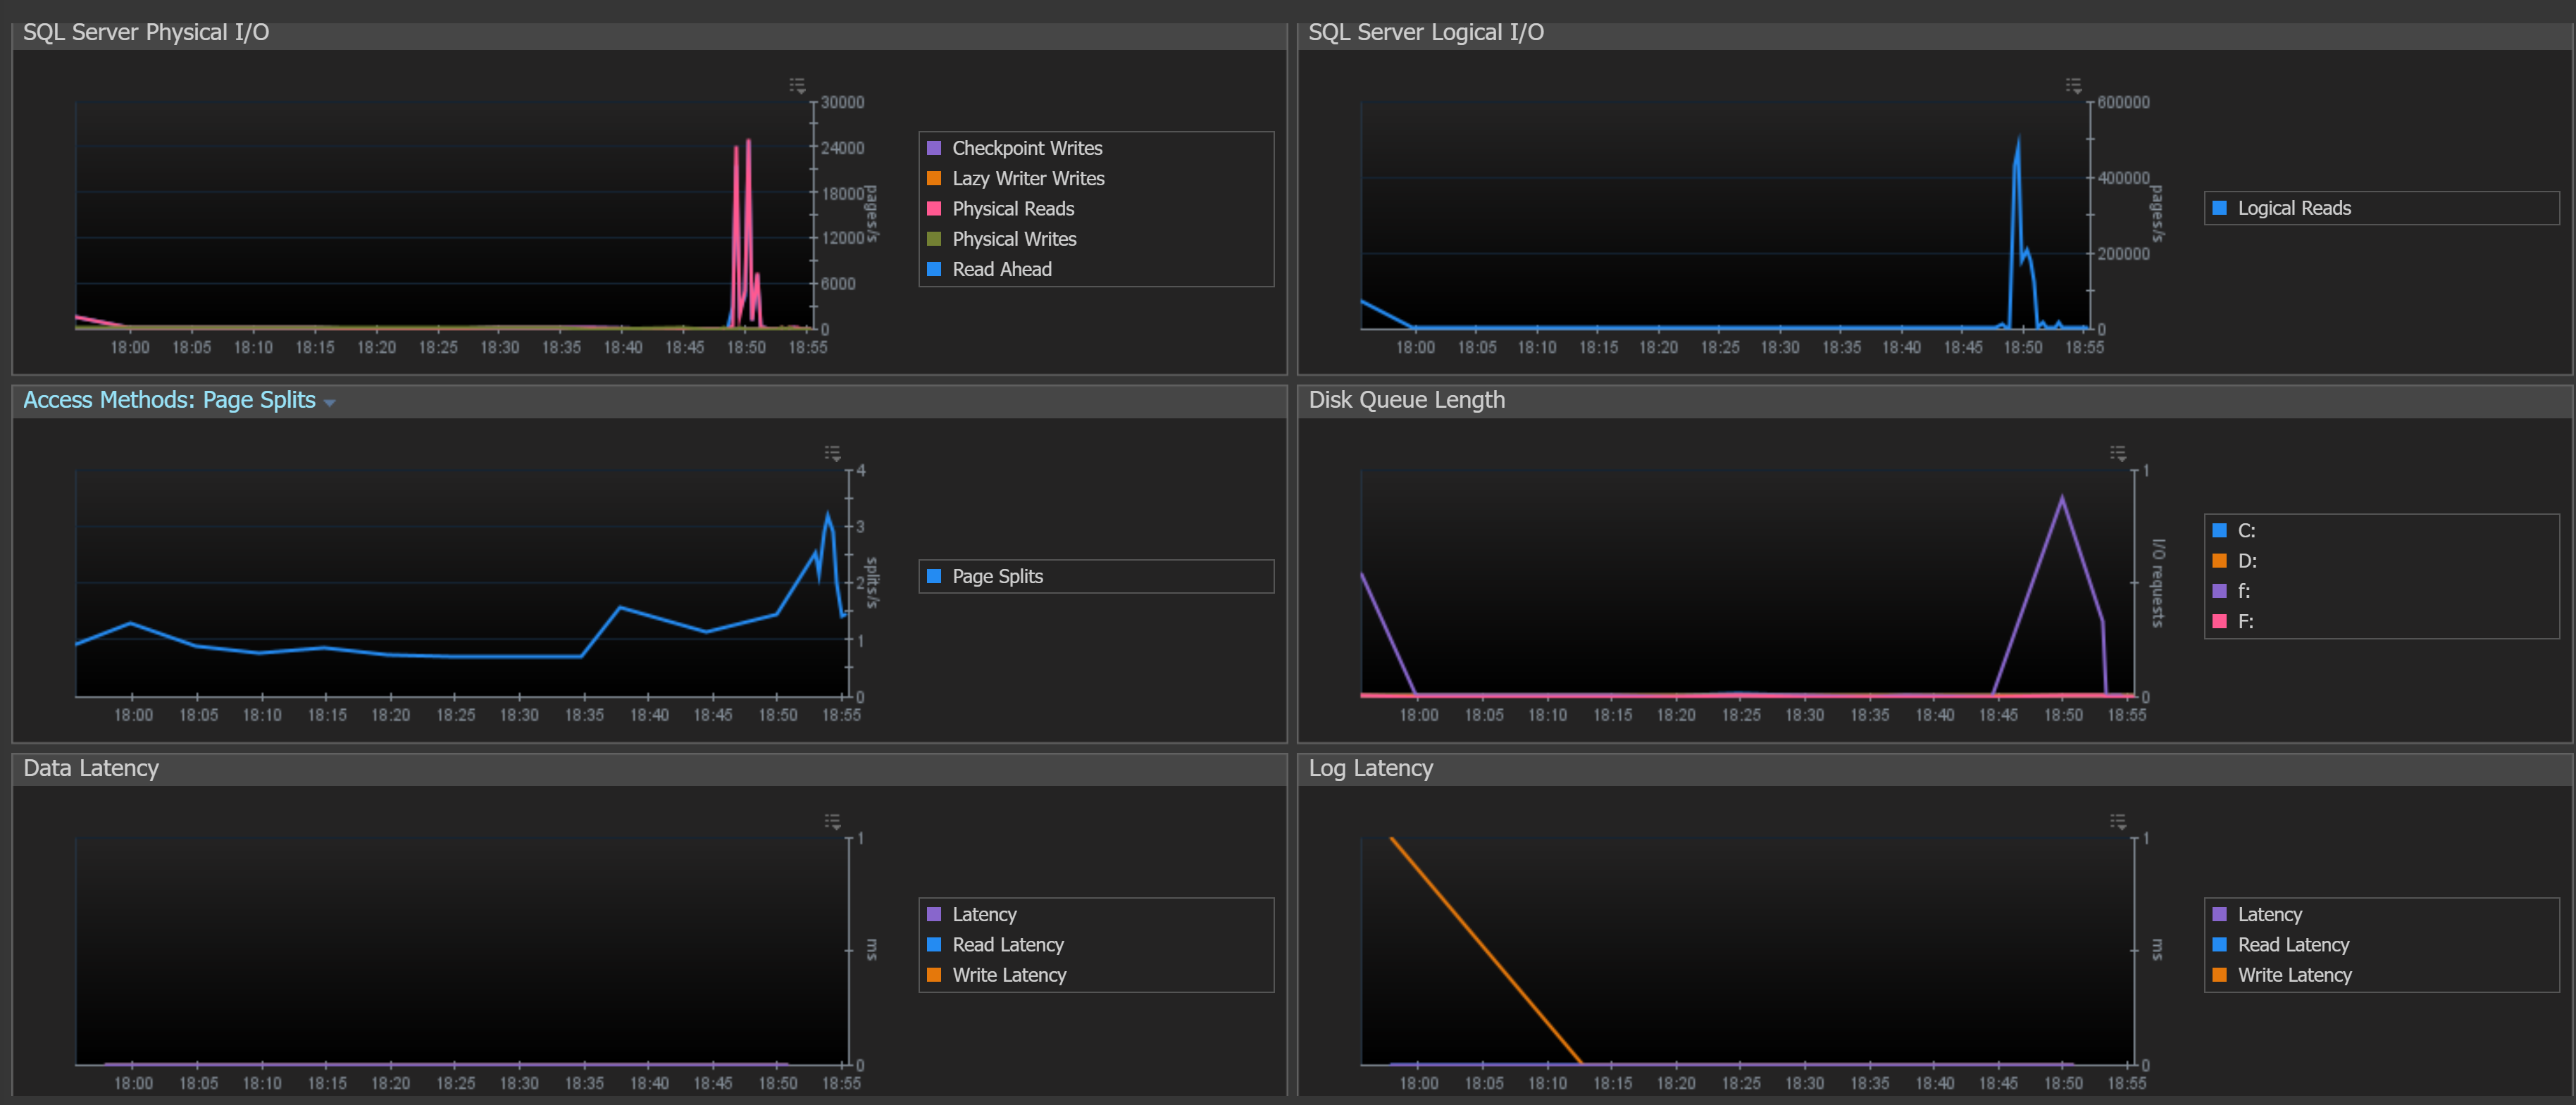
Two new charts added to Activity → I/O Activity dashboard
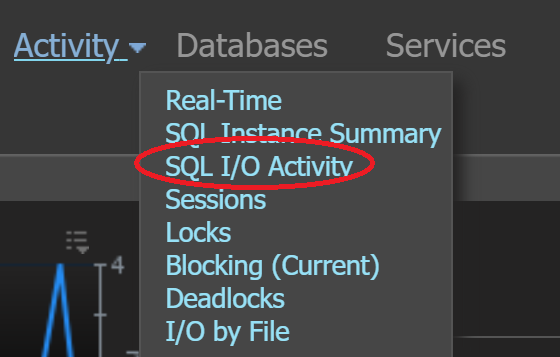
- Data Latency: Summary of data files R/W latency
- Log Latency: Summary of log files R/W latency
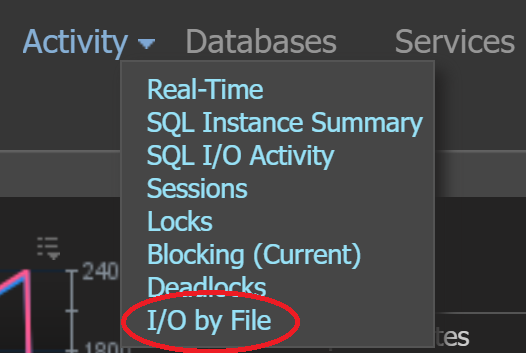
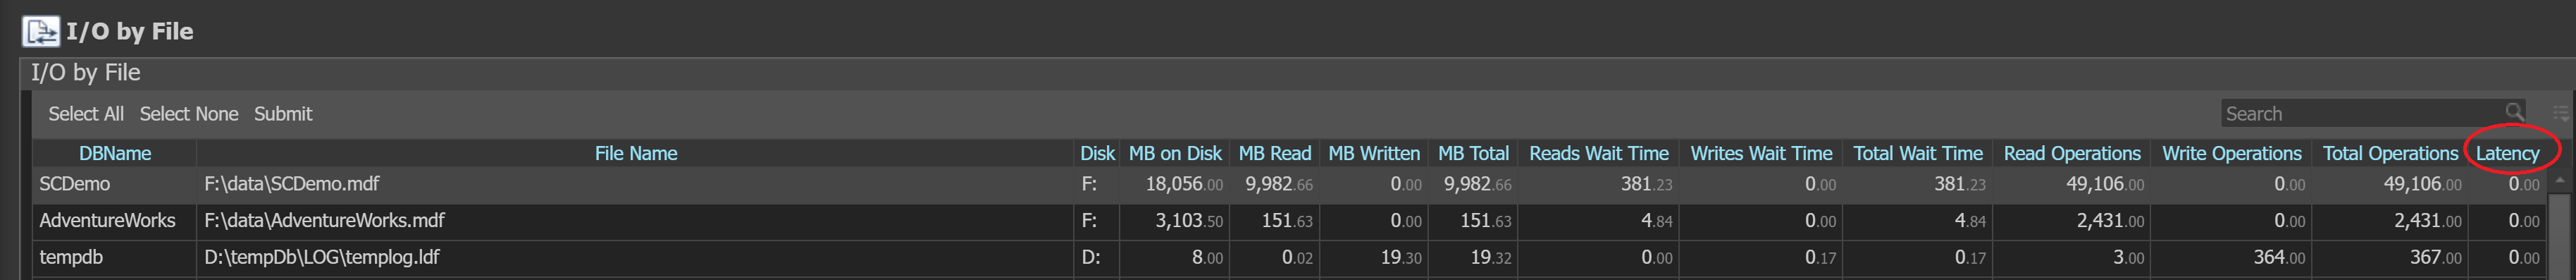
R/W latency metrics added to Activity → I/O by File dashboard
Visit Foglight for Databases to learn more and download a free trial.
