
To begin working with Derived Metrics, I would like to start with collection metrics. What is a metric in Foglight? A metric is for example the CPU or memory utilization of a host. Foglight stores the collected values historically in the Foglight repository. The values can be visualized in dashboards and reports and can be used for alarming in rules. Cartridges come with several metrics OOTB. A metric is a set of values over time. You can see a collected value for a specific point in time.
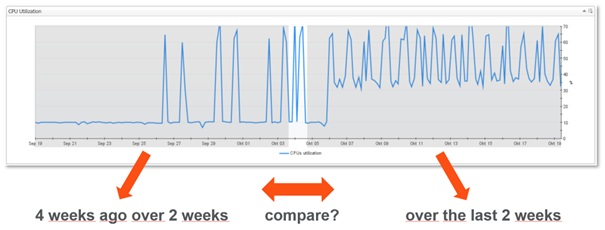
When you plan to predict or analyze growth etc., you need to be able to compare different time intervals.
For example:
The average utilization over 2 weeks from 4 weeks ago with the values over the last two weeks. That’s where DMs come into play. Derived metrics enable you to do calculations on OOTB metrics over a time interval of your choice. In this example we would like to compare the average CPU utilization over 2 weeks from 4 weeks ago with the average value of the last two weeks.
What is a derived metric in Foglight?
- Pre-defined calculations used for the collected metrics
- Attached to a scoped topology type
- For use in dashboards, rules and reports
- Several derived metrics are pre-defined and available out-of-the-box
A derived metric has a name and an expression to define the calculation. Here is a simple example of an expression:
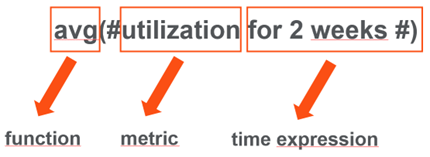
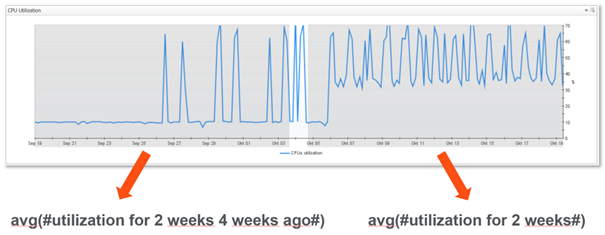
It says, “Give me the average CPU utilization over the last two weeks”. We see the mathematical function, in this case average (avg), the metric to use and a time expression, to define the observation period. So if you would like to calculate the average utilization for two weeks from 4 weeks ago and for the last two weeks, the expressions would look like this.
Now let us create a derived metric.
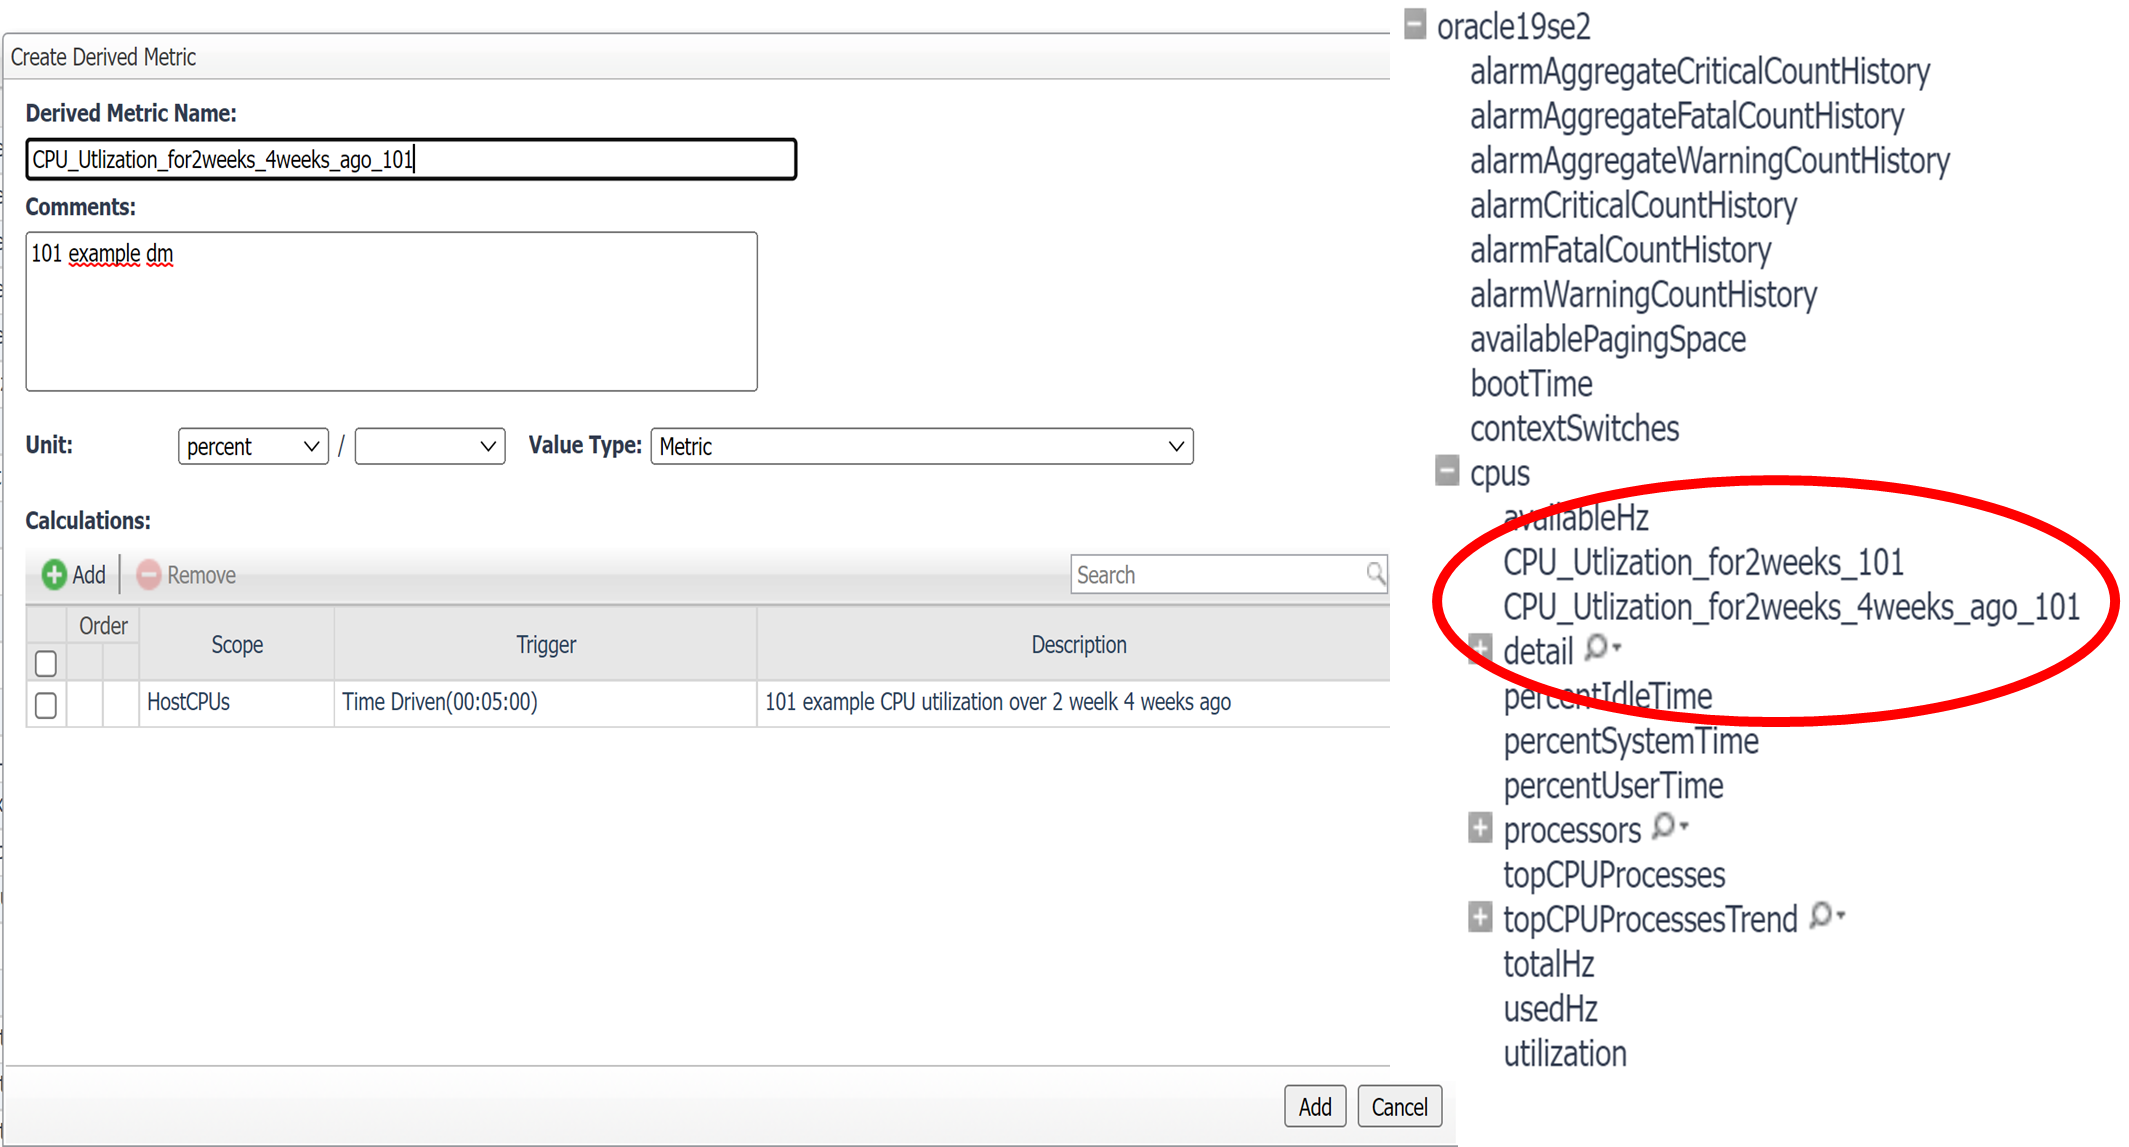
Under Administration/Data/Derived Metrics you will find the DM dashboard. Click on add, give the derived metric a name and a unit. In our case percent.
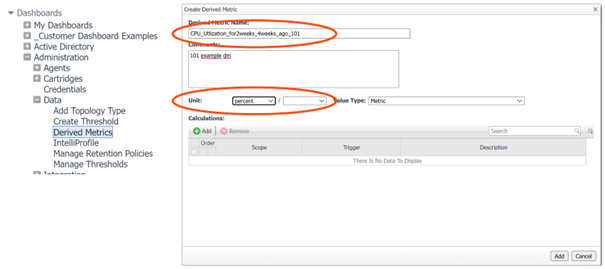
Then add a calculation.
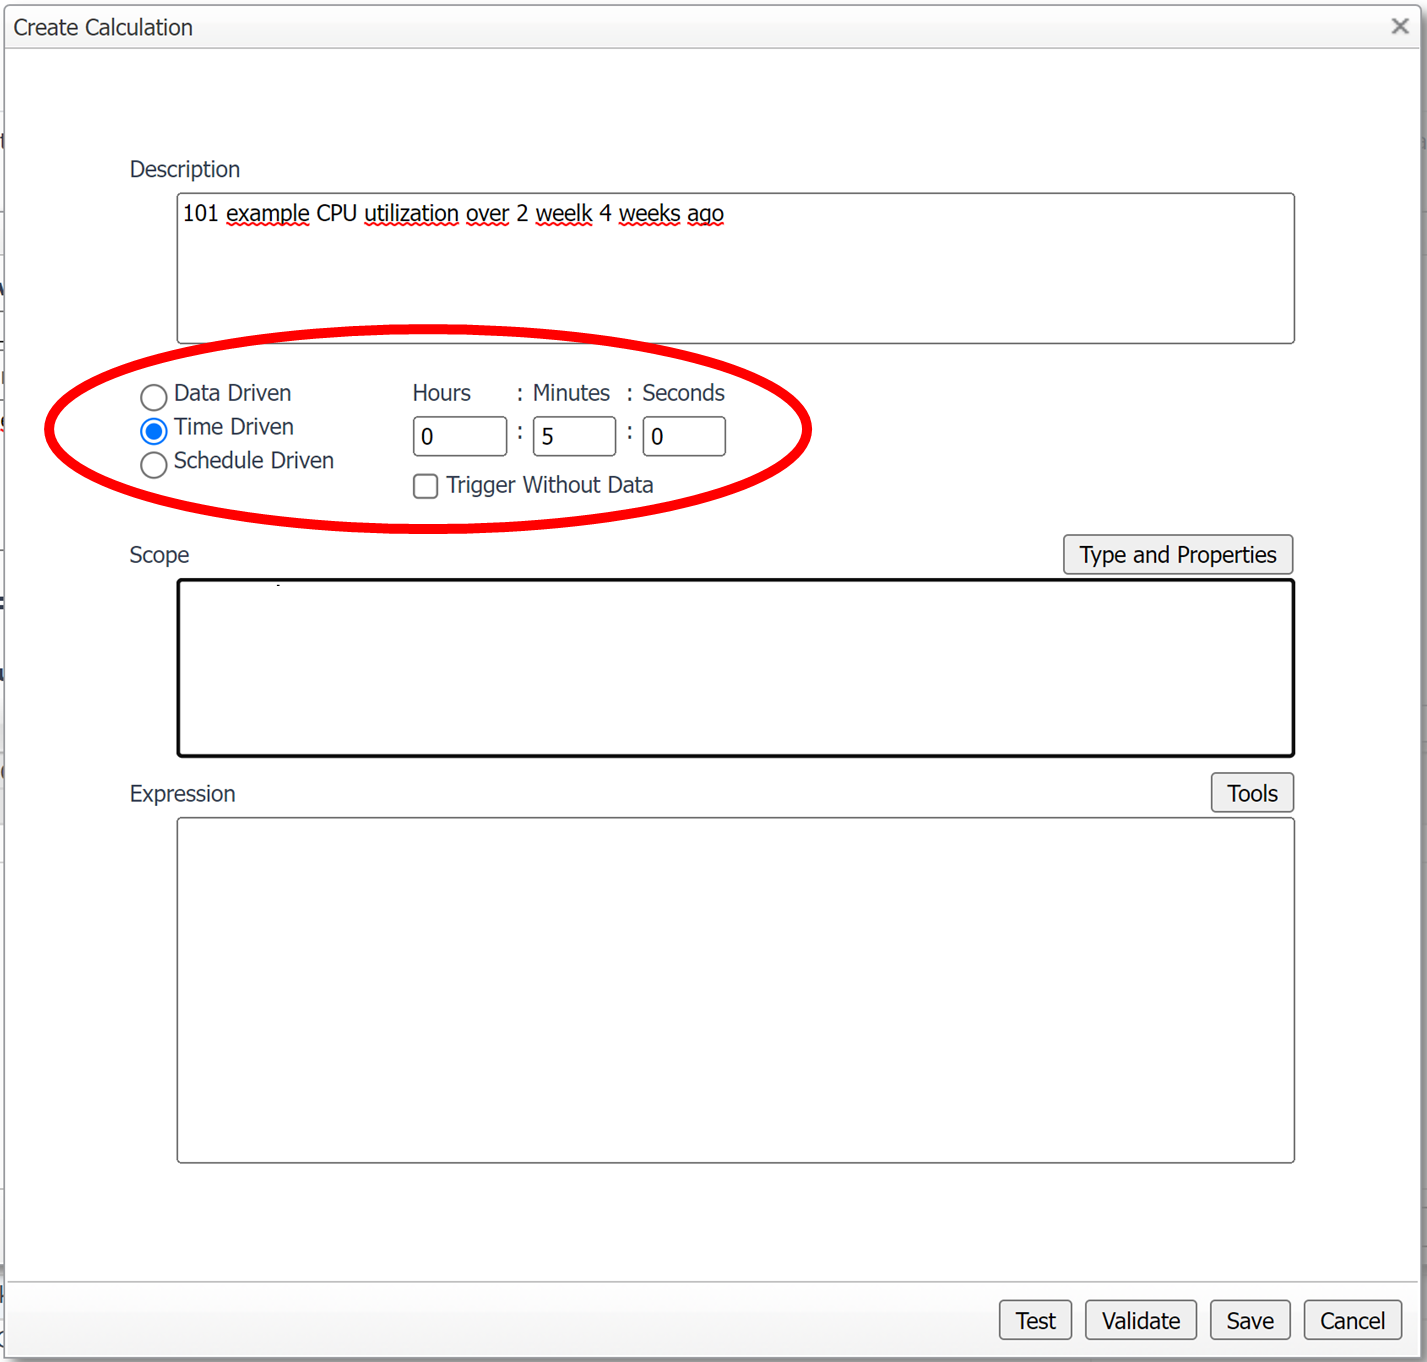
The first step is to decide when the calculation should be executed.
- Data Driven -> Every time a new collected value for the underlying metric is available.
- Time Driven -> Based on a specified time interval e.g., every 5 minutes.
- Schedule Driven -> Based on a schedule defined in Foglight.
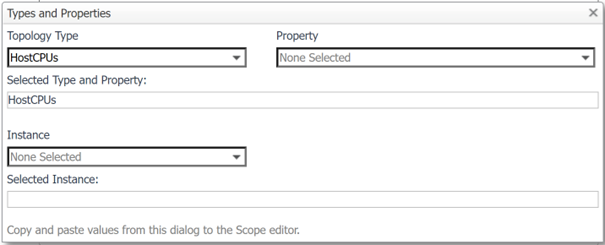
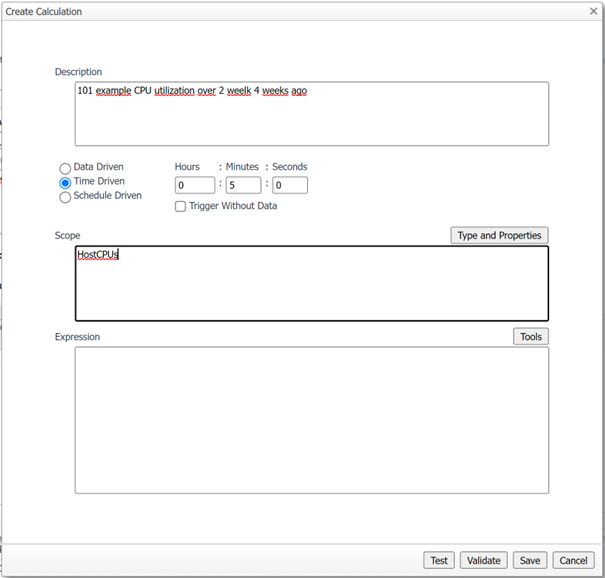
Under scope you need to add the corresponding topology type. In our example HostCPUs as it contains the CPU Utilization metric. By clicking on “Type and Properties” you will get a helpful dialog to find the right scope. Please refer to the Foglight Data Model Guide or look under Configuration/Data in the Foglight menu.
After the scope is set, we now need to create the expression for the derived metrics calculation. In our example it will be the average CPU utilization over two weeks from four weeks ago. Clicking the “Tools” button helps finding the right metric for the expression.
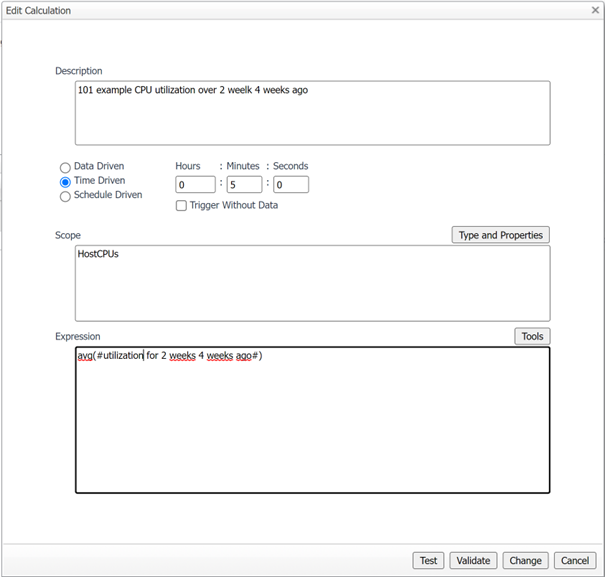
You can now test and validate the expression and save it by clicking on “Change”
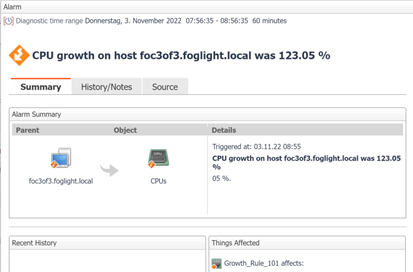
The new derived metric will now be available for every CPU and like every other metric it can be used in reports, dashboards, and rules or in other derived metrics.
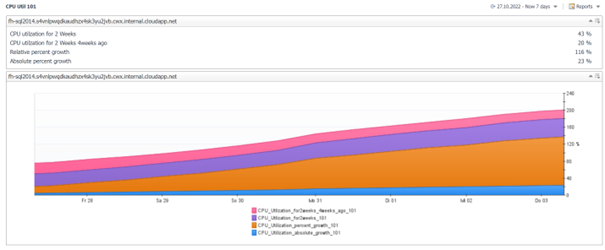
Here are two examples of how to use derived metrics in additional derived metric to calculate the growth between two time intervals.
Absolute Growth (50% to 100% = 50% growth)
def growth = (#CPU_Utlization_for2weeks_101#)-(#CPU_Utlization_for2weeks_4weeks_ago_101#)
return growth
Percentage Growth (50% to 100% = 100% growth)
def per = 0
def growth = ((#CPU_Utlization_for2weeks_101#)/(#CPU_Utlization_for2weeks_4weeks_ago_101#))
if (growth >= 1) {per= ((growth*100)-100)}
else
{per = ((100 - (growth*100))*-1)}
return per
Functions and time
Here is a list of available functions and time expressions for the use in derived metrics.
- avg, min, max, count, sum, delta, delta_rate, histogram, stddev, rate, period
- minutes, hours, days, weeks, month and years
Examples:
avg(#utilization from HostCPUs for 2 weeks#)
-> returns the average utilization over the last two weeks
count(#utilization from Memory for 2 weeks 4 weeks ago#)
-> returns the number of untilization metrics from 4 weeks ago over 2 weeks
delta(#utilization#)
-> returns the difference between the maximum value of the latest two utilizations
metrics of the scoping object
delta_rate(#utilization#)
-> returns the difference between the maximum value of the latest two utilization metrics
of the scoping object divided by the time period of the latest metric.
histogram(#requestResponseTime for 1 hour#)
-> Get the histogram of requestResponseTime metric over the last hour, put them into
the following buckets, 0-30 (ms), 30-100, 100-1000, 1000-10000, 10000-30000,
30000 up
max(#queueSize from J2EEExecuteQueue for 1 hour#)
-> returns the maximum value of queueSize metrics of all J2EEExecuteQueue objects in
the system over the last hour
min(#queueSize from J2EEExecuteQueue for 1 hour#)
-> returns the minimum value of queueSize metrics of all J2EEExecuteQueue objects in
the system over the last hour
period(#utilization for 5 minutes#)
-> returns the total time period covered by the utilization metrics of the scoping object
over the last 5 minutes.
rate(#utilization for 5 minutes#)
-> returns the total of the utilization metrics of the scoping object over the last 5 minutes
divide by the total time period covered by these metrics.
stddev(#queueSize from J2EEExecuteQueue where name like 'Nexus%’#)
-> returns the standard deviation of latest queueSize metrics of all J2EEExecuteQueue
objects whose names start with "Nexus“
sum(#utilization for 5 minutes#)
-> returns the sum of utilization metrics over the last 5 minutes
