
Article Contributed by Lior Asta
With more on your plate than ever, cross-platform database monitoring is critical. You can’t afford any database downtime or performance degradation. Foglight helps you to avoid risk and stress, spend more time on strategic initiatives and ensure your business runs smoothly.
Foglight cross-platform database software allows you to proactively improve database performance and increase visibility by monitoring all your diverse databases centrally, through a single console. With alerting, diagnostics, performance analytics and more, you’ll easily optimize database health – across your entire environment.
And now for the chill
Cloud-based data warehouses and data lakes continue to be in high demand as companies look to reduce costs, move data to the cloud and decrease vendor lock-in. Snowflake is a common choice as it offers the promise of eliminating data silos and unifying structured and unstructured data in their cloud-hosted data warehouses and data lakes.
Foglight for Snowflake is a powerful monitoring solution that provides an in-depth view of your Snowflake environment. It includes several key features that help you keep track of all the important aspects of your Snowflake environment, including availability, storage distribution and growth, performance and pipe activity and queueing, warehouse status, resources, and credit.
See what’s new.
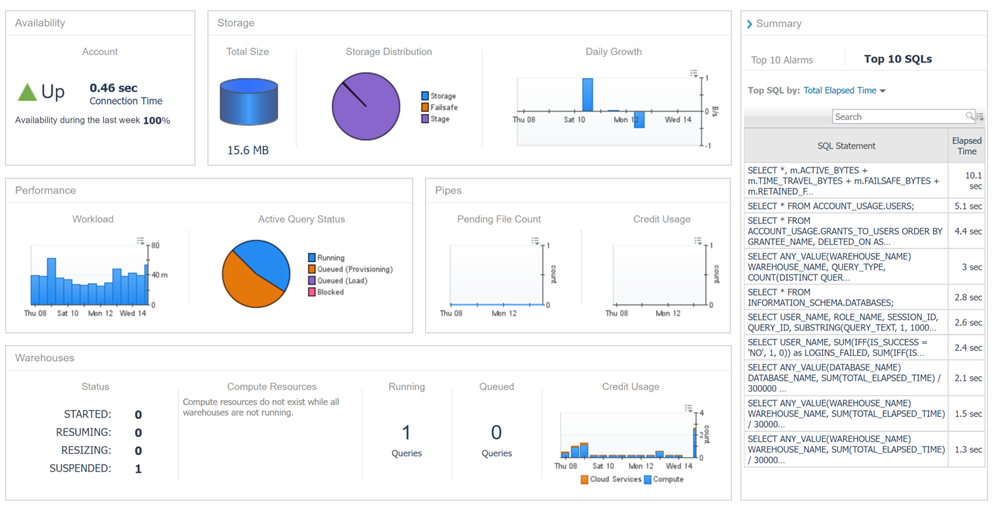
Overview
The Overview page provides an overview of key segments for a Snowflake account.
Information includes availability, storage distribution and growth, performance and pipe activity and queueing, and warehouse status, resources, and credit.
The page's right-side features include an expandable summary box that displays the Top 10 Alarms by severity currently active for this account as well as the top 10 queries collected.
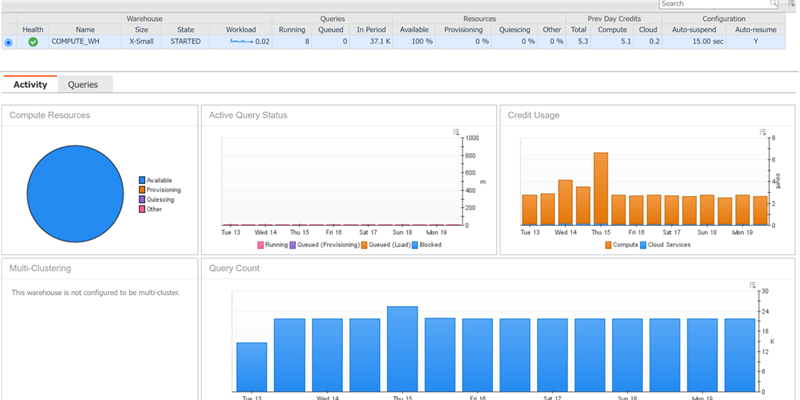
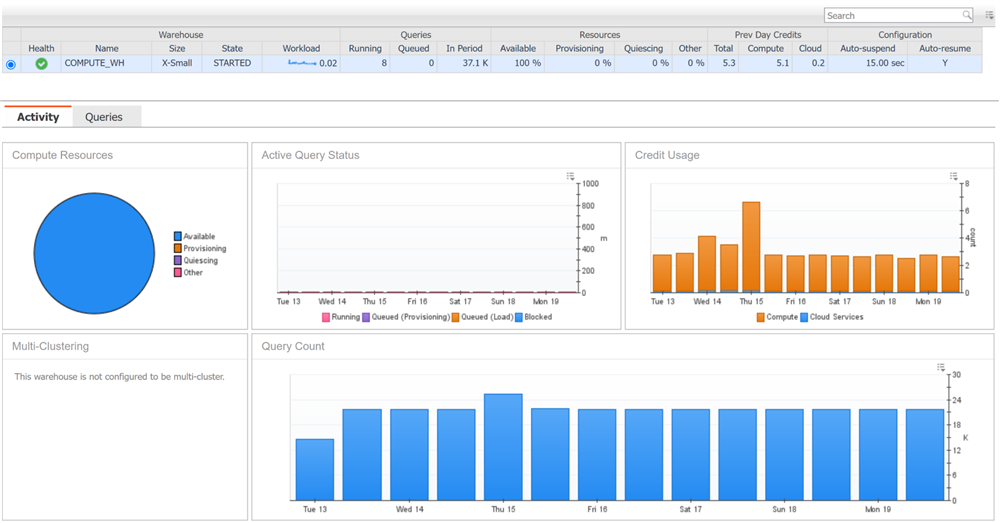
Warehouses
The Warehouses dashboard lists all warehouses in the account along with their configuration information.
The Activity tab features several graphs that provide a historical view of activity for the warehouse.
The Queries tab features a table that groups the queries run on the warehouse by type and displays information such as query outcomes, elapsed time, and credit usage.
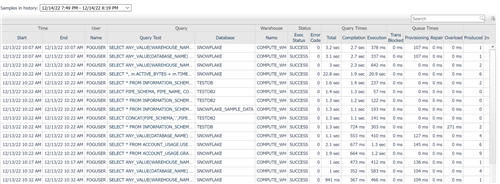
Queries
The Queries page displays the top x number of queries for each sample period.
Available data includes query execution time, user, role, and session, database and warehouse, and result status.
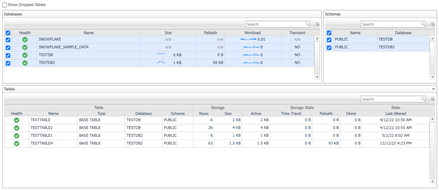
Storage
The Storage page contains information on the databases, schema, and tables in the Snowflake account.
The Databases table lists all databases along with their space used for storage and failsafe data.
The Schema table lists all schemas contained in selected databases.
The Tables feature configuration information, storage usage by rows and size, and clustering information if applicable.
Pipes
The Pipes page lists all pipes in the account along with their configuration, activity, and state.

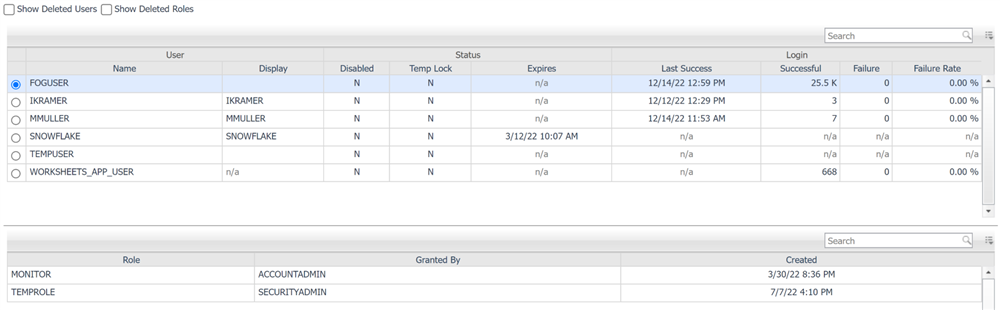
Users
The Users page lists all users in the Snowflake account along with their status, configuration details, and login information.
Snowflake Rules & Alerts
The following is a summary of rules available out-of-the-box with the Snowflake cartridge.
Snowflake Availability
Alert if the availability is less than 100% for two consecutive periods.
Snowflake High Account Workload
Alert if the account workload is significantly higher than its historical weekly average.
Snowflake High Database Storage Growth
Alert if the database workload is significantly higher than its historical weekly average.
Snowflake High Database Workload
Alert if the database growth is significantly higher than its historical weekly average.
Snowflake High Percentage of Queries Blocked
Alert if there is a high percentage of queries blocked.
Snowflake High Percentage of Queries Failed
Alert if there is a high percentage of failed queries.
Snowflake High Percentage of Queries Queued
Alert if there is a high percentage of queries queued.
Snowflake Pipe Execution State
Alert if the pipe execution state is not running or paused.
Snowflake User Failed Logins
Alert if a user has had failed login attempts in a period of time.
Snowflake Warehouse Credit Usage
Alert if a warehouse's average daily credit usage is significantly higher than its historical weekly average.
Snowflake Reports
The following is a summary of reports available out-of-the-box with the Snowflake cartridge.
Snowflake Credit Usage Report
Displays credit usage for compute and cloud services by warehouse along with workload and total queries run in the time period.
Snowflake Pipes Report
Displays all pipes in account with information on data insertion size, credit usage, and current status.
Snowflake Queries Report
Displays top x queries by the selected metric in the time range with result, query and queue timing, and credits used.
Snowflake Tables Report
Displays top x tables by the selected metric with table configuration, size and storage distribution, and last alteration date.
Snowflake Users Report
Displays Snowflake users in an account with configuration, active roles, login activity, and security information.
Ready to see for yourself? Download a free trial here.
