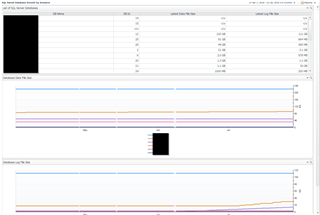
The Database Administration Manager communicated his need to efficiently gather and report upon growth data in the QA and Production environments. The project at hand was to build an accurate growth model for 6, 12, and 24 month time windows. He explained he also needed data like Session Counts, CPU and Memory Utilization, Storage, and I/O Throughput. The current method required executing script after script against each individual instance over a period of time. Additionally, Excel was used to help aggregate some of that data.
By creating custom dashboards and reporting off those dashboards, the DBA team was able to quickly gather all required information into a single report. This allowed the data management team to see the growth trends on all required metrics. Then, using the historical trend data, it was easy to compile growth models.
The DBA Manager shared a summary of the time savings: "On average, it would take a DBA 10 minutes per instance per capture period to gather the require data at the level we desired. With over 250 production and QA instances and 6 capture periods over the course of a month, this would have taken over 200 hours to complete...not to mention the 24 to 48 additional hours to aggregate all the data into a useable data set. "
With the Foglight database monitoring dashboards, "...pulling this data can be done in a few clicks."
Visit Foglight database monitoring to download a free trial.


