
In Foglight Cloud 7.3.1, you now have the ability to generate and view the execution plan for PostgreSQL.
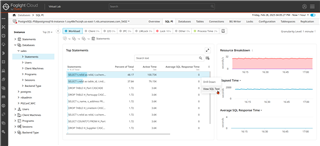
Within SQL Performance Investigator, you can choose your time frame and drilldowns. In this case I started with the most recent hour and isolated the "sales" database first, but this is "choose your own adventure."
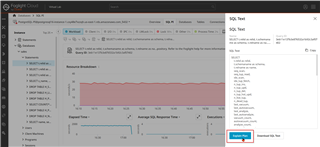
Once you get do a SQL statement, there is an option to "View SQL Text".
From the SQL Text pop-up, chose "Explain Plan".
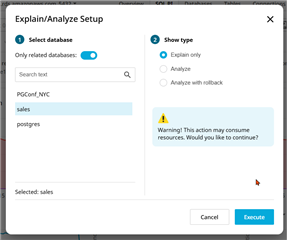
There are several options to choose from. You can pick a different database if you want along with options to show the plan or analyze.
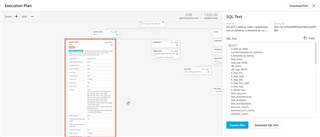
The plan viewer lets you zoom in/out, inspect steps of the plan along with saving the SQL (text format) or plan (JSON). The planning time and costliest node are highlighted at the top.
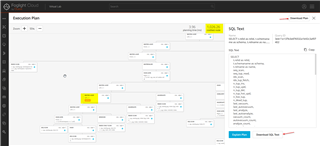
You can inspect each node simply by clicking on it for more details.
We hope you get value out of this new feature. Please provide your feedback too!
