
First, a brief introduction….
Formally named PostgreSQL (and pronounced /ˈpoʊstɡrɛs ˌkjuː ˈɛl/), it is an object-relational database management system with roots from the Ingres project at the University of California, Berkeley. PostgreSQL is open source, meaning its original source code is made available and may be modified and/or redistributed. The PostgreSQL database is growing in popularity and adoption. DB-Engines ranked PostgreSQL 3rd overall in the 2016 DBMS of the year.
A primary reason for the PostgreSQL appeal is its mature, stable, and reliable SQL engine.
Taken directly from the PostgreSQL website Quotes section:
Under loads heavy and light, with virtually no administration overhead, PostgreSQL chugs along and "just works". Benjamin Smith, CTO, Charterworks
Another draw to PostgreSQL is its cost of implementation. It offers a permissive software license, which is a free software license with minimal software distribution requirements. That said, there are paid options as well like the Enterprise Database (EDB) Postgres Enterprise subscription. More and more companies are moving from more expensive DBMS platforms, like Oracle, to PostgreSQL. EDB offers tools and services to assist with migrations to PostgreSQL too.
Quest’s flagship cross-platform database monitoring and diagnostics solution – Foglight – can support your PostgreSQL environment.
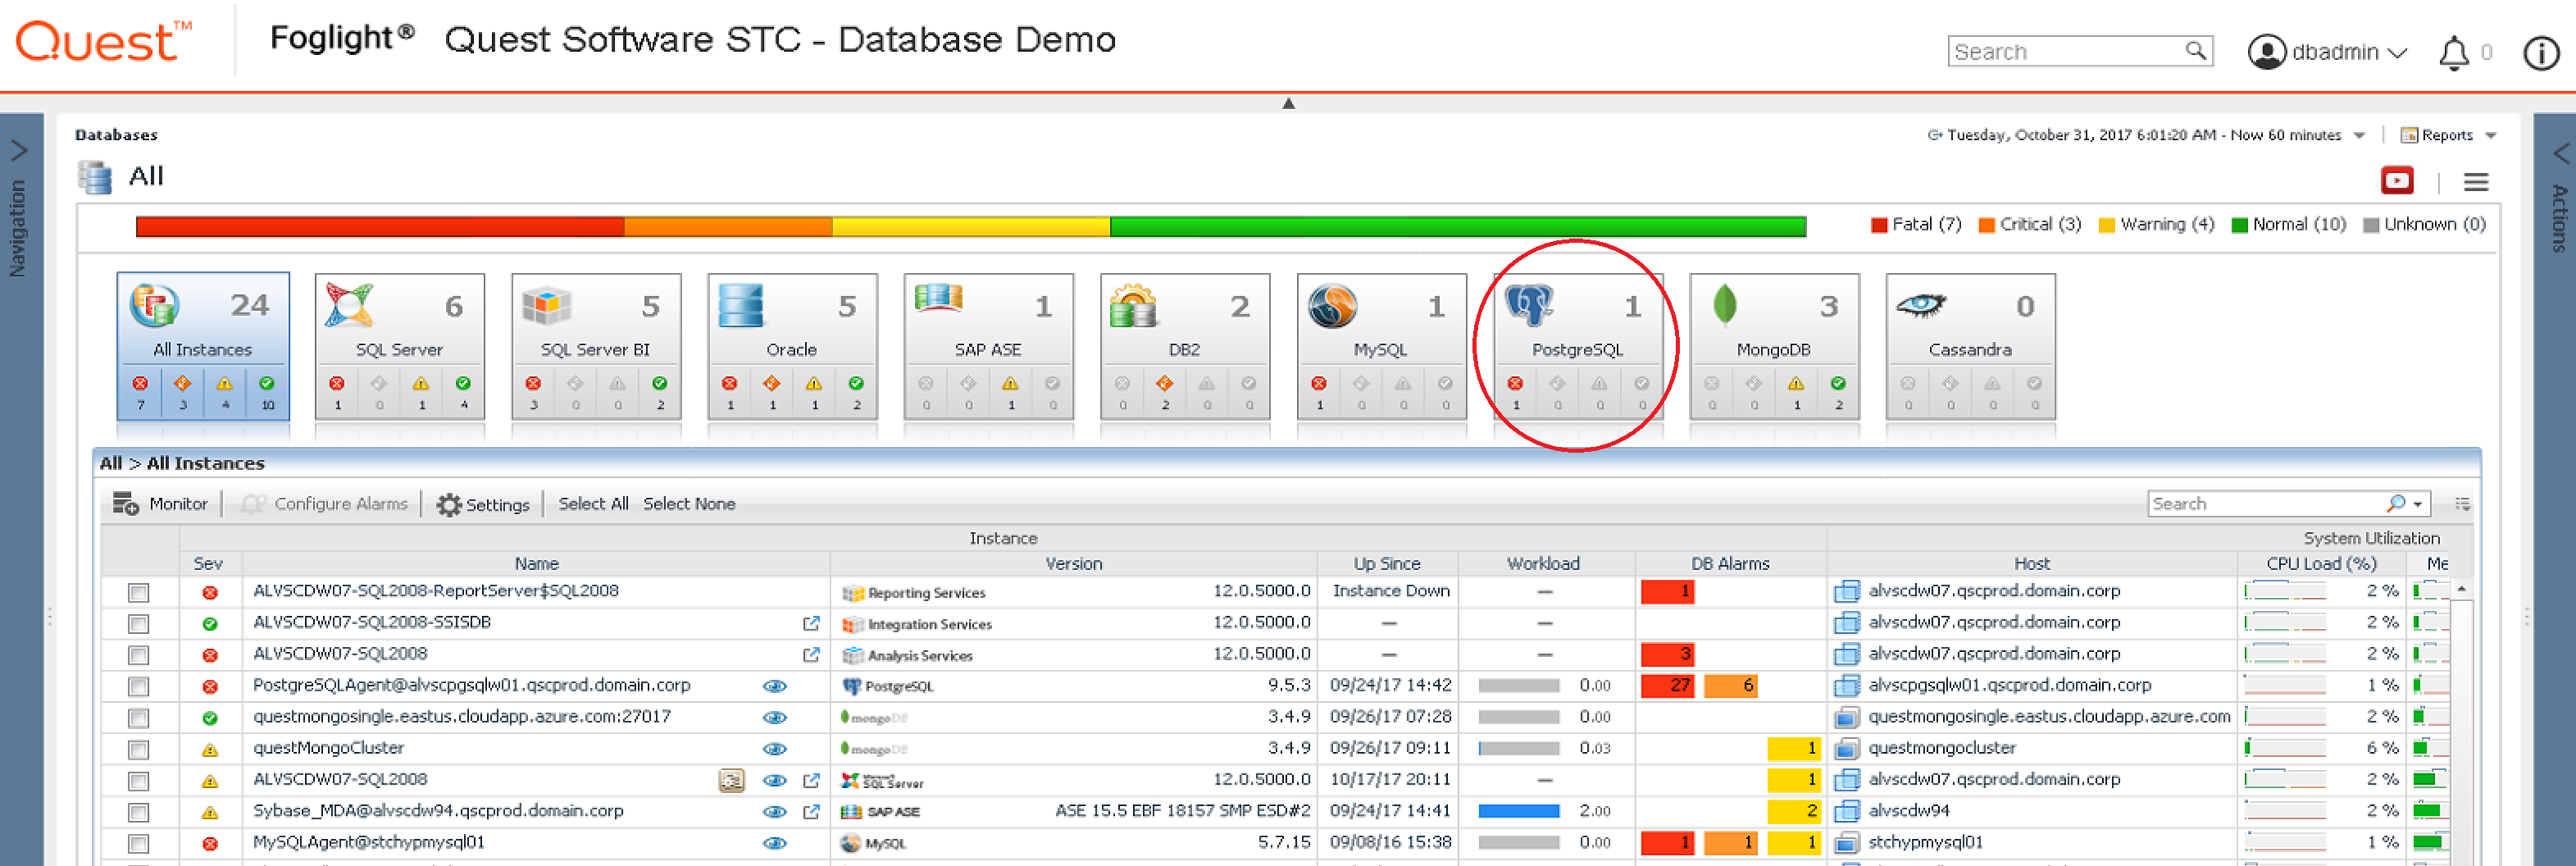
Foglight simply queries the PostgreSQL system tables and displays the performance metrics in its web interface.
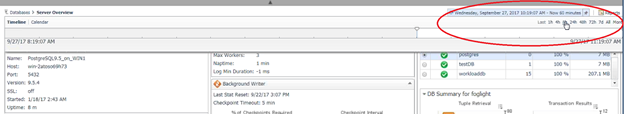
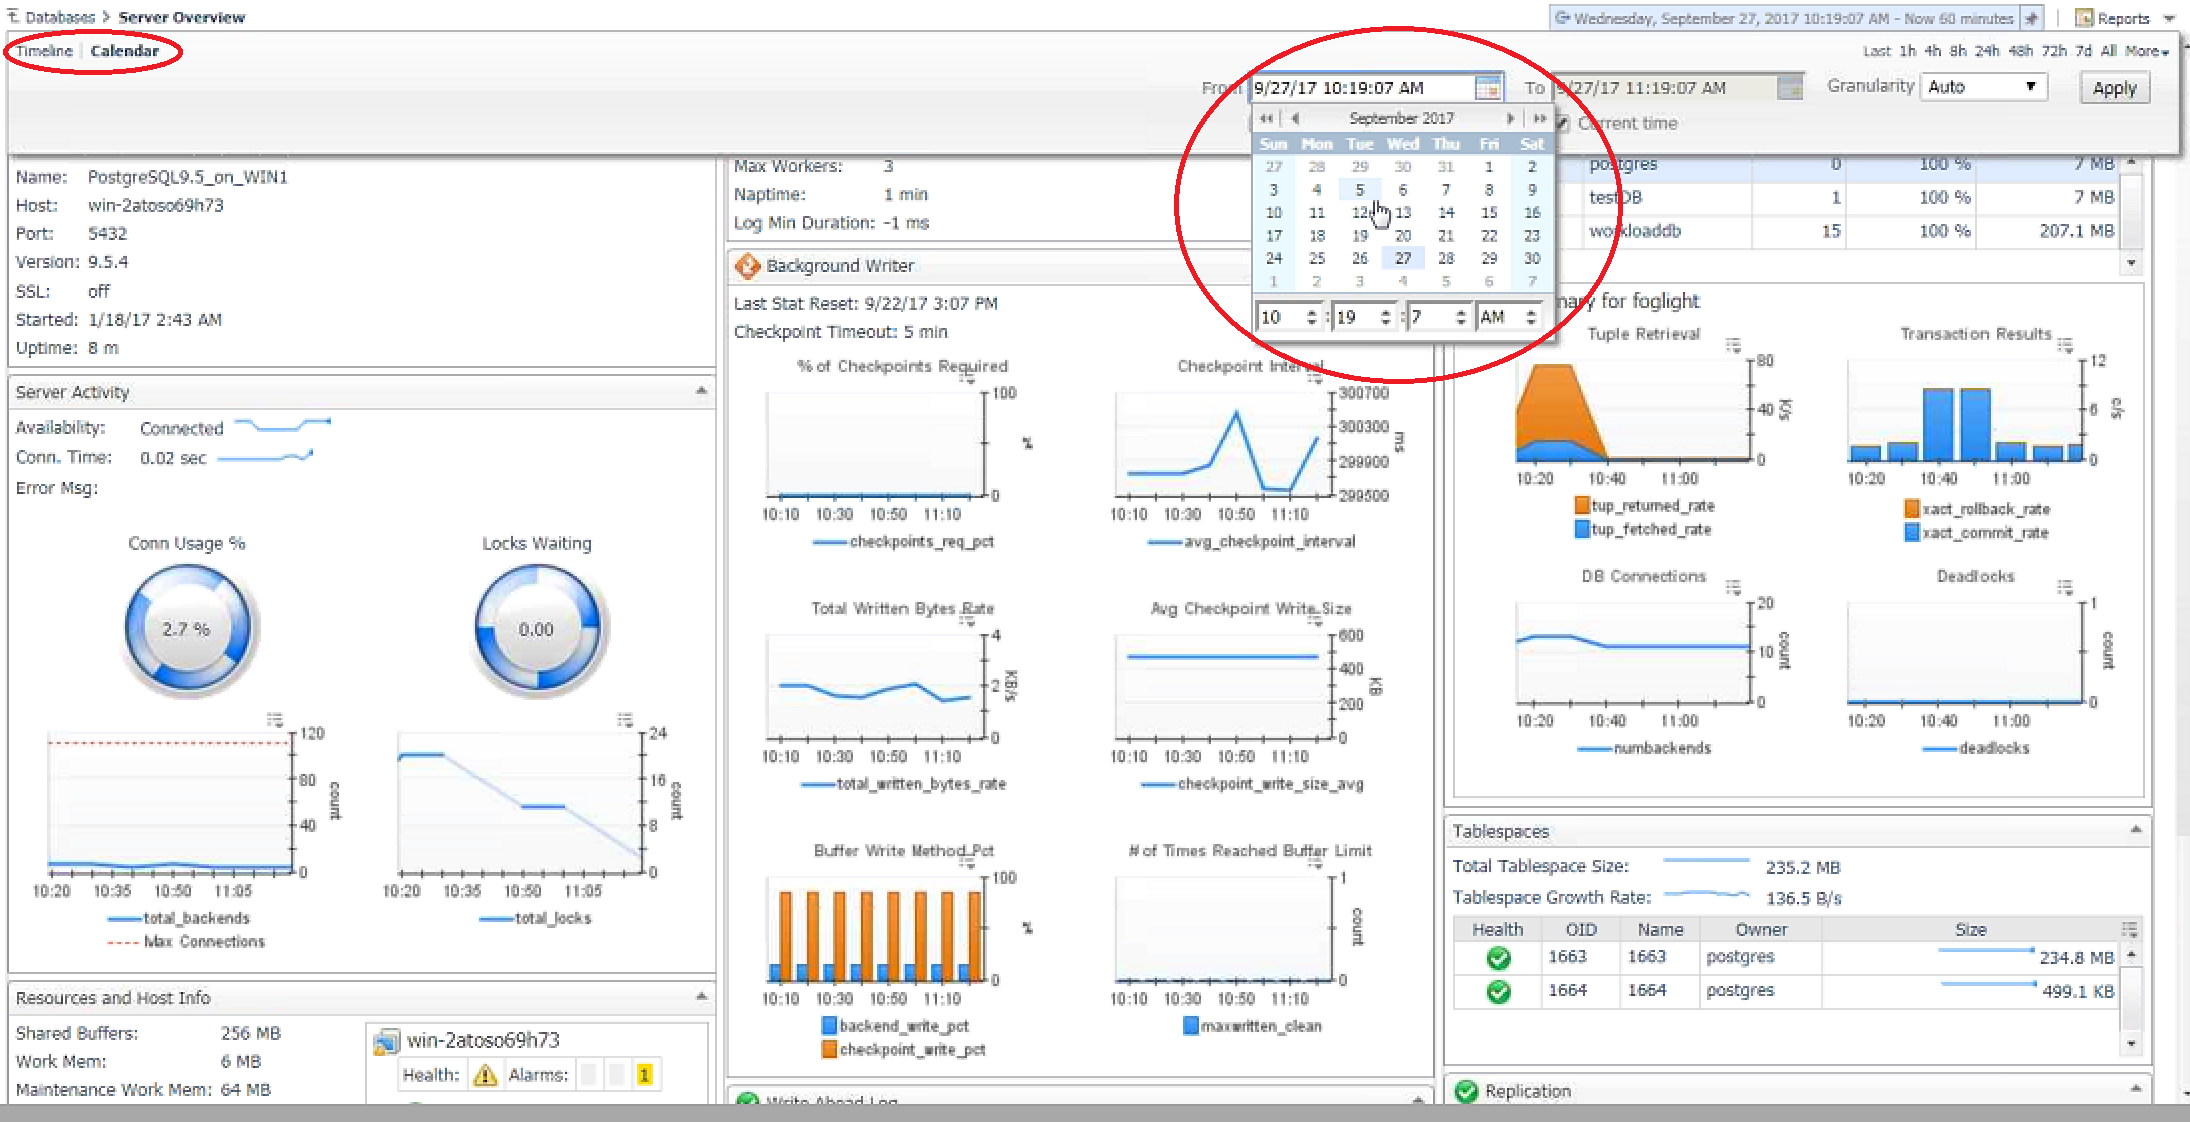
Standard to Foglight is the ability to either view (near) real-time data (depending on the last refresh) or easily access historical data, either by a sliding window of time or a calendar.
Here are some highlights of key monitoring and diagnostics capabilities in Foglight against PostgreSQL…
From the Overview drilldown, understand server activity like if the agent is connected, how long it took to connect, the number of connections being used, and locks waiting.
Quickly see Auto-vacuum configuration and background writer information. This is important to consider when tuning your server – based on the amount of data being written to it.
View Tablespace information and corresponding growth rates.
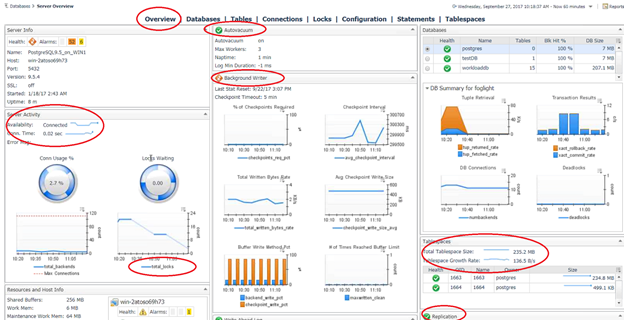
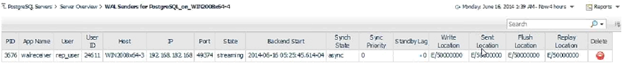
Monitor Replication – Users, Hosts, States, any lag (and be alerted on this), and the location of the files.
In the Databases drilldown, view the individual databases and their health status. Tables and Functions information is available here too. The Database Summary provides lots of helpful information around ‘tuples’ (loosely defined as rows), transactions, deadlocks, memory operations, and table highlights.
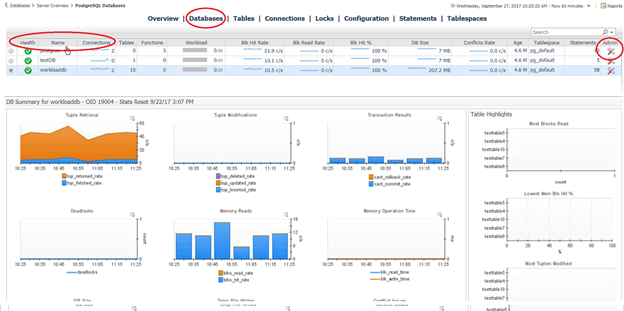
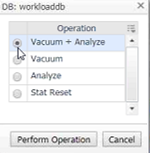
The option on the far right allows users (with Admin access and proper configuration) to perform some Administrative actions against the database.
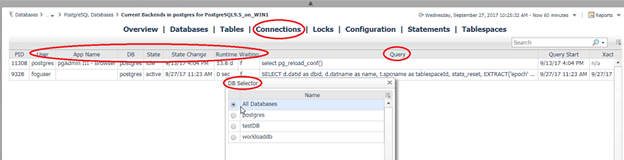
Drill into particular connections for more details like the User, App Name, its state, waits, and the last query executed. Optionally, click on the Connections drilldown to view all databases or switch to other databases.
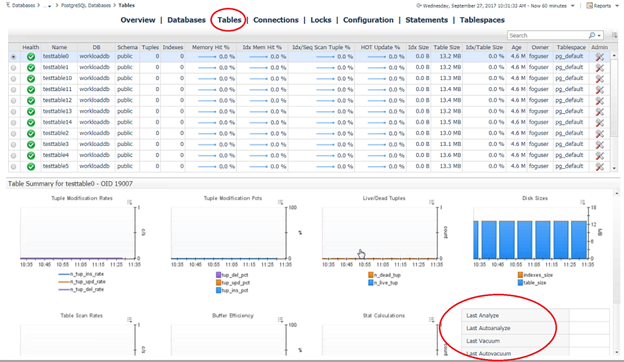
In the Tables drilldown, see the Hit percentages for tables and indexes, as well as similar information seen in the database drilldown (only table level). Sometimes, users want to see when Auto-vacuum was executed against particular tables. This information can be viewed in the lower right corner along with Last (Auto)/Analyzed. It’s also here where you can determine when to vacuum (or be alerted to do so) if there are high dead tuple rates or bloated indexes. And, like the Database View, access administration functions to address them.
On the Locks page, identify Total Locks and Locks Waiting (vs Granted).
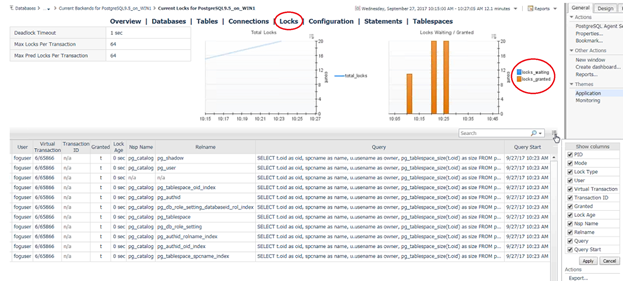
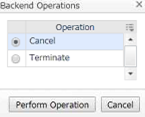
If it is enabled on the agent and have the Foglight Administrator role, it is easy to address a common use case – locks or deadlock transactions. Find them in the Locks drilldown (you can be alerted and notified as well), then switch to the Connections page, click the Admin icon, and cancel or kill the query from Foglight.
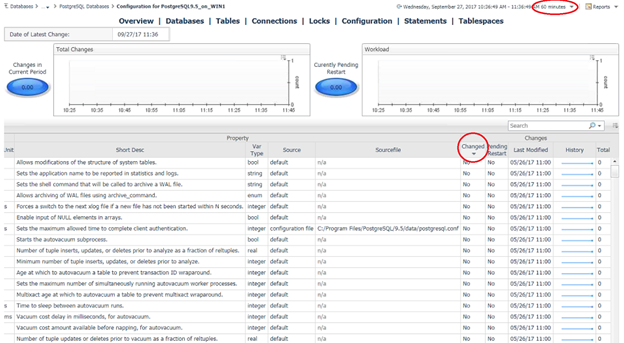
The Configuration page allows for seeing configuration settings at the beginning and end of the customizable time range and if the configuration settings changed during that time. Reports can be generated to assist with compliance.
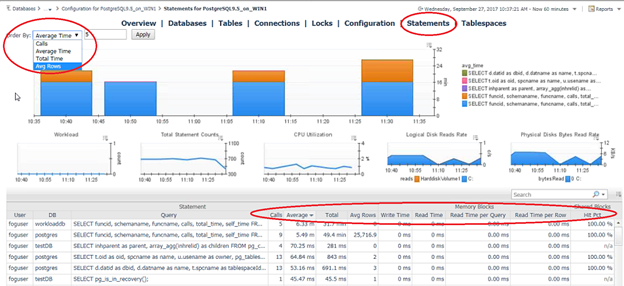
The Statements drilldown displays collected statements (aggregated). It shows the number of calls, average and total time, and more. The drop-down in the top left allows for choosing to order the statements by these statistics.
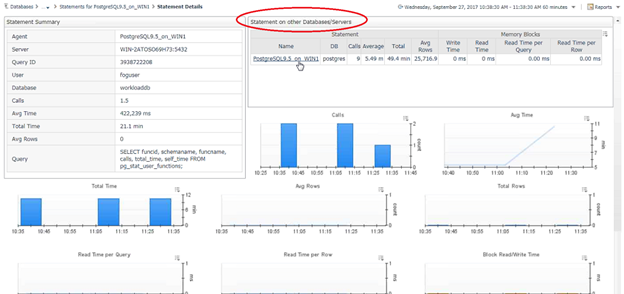
Drill into individual statements and track how they performed on other databases and/or servers to compare performance.
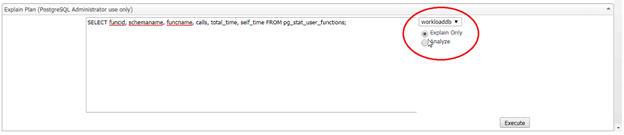
At the bottom of the page, execute Explain Plans and/or Analyze. Permissions for this are configurable.
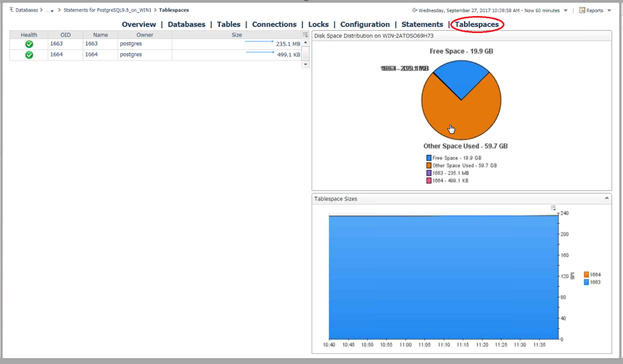
The Tablespaces page shows disk space distribution and tablespace sizes.
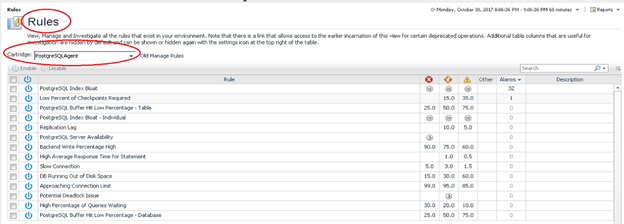
Configurable rules for alerting, notifications, and actions are available.
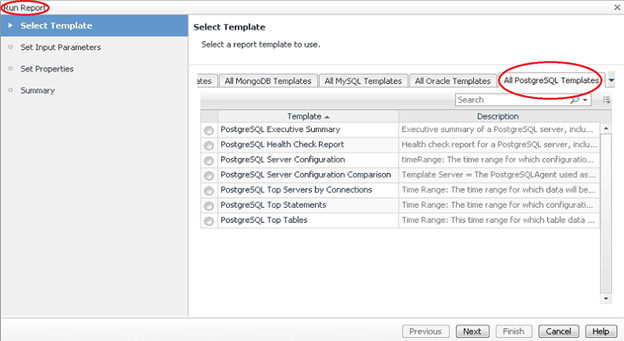
PostgreSQL reports can be run on-demand or scheduled.
For more information, or to request a trial, visit the product page: Foglight database monitoring
