The other day I was speaking to a customer about their growth strategy and planning on database management and infrastructure. One of the topic that I really liked is how companies get very creative and innovative. One of the strong drive for them is to adopt the latest technologies, and to transition with minimal disruption internally. They were planning to move some or all of their infrastructure into Amazon’s AWS Cloud. The question was how difficult it is to monitor an AWS EC2 windows instance with Foglight’s InfraStructure Cartridge.
Ideally, if you were to monitor a windows machine on AWS there isn’t much difference as long as we have connectivity, port, protocols opened up. Here are 3 steps to deploy and monitor a windows EC2 instance – Prepare, Configure and Monitor
Prepare an EC2 Instance to be monitored by Foglight’s InfraStructure Cartridge (Host Monitoring)
1. Ensure an EC2 instance is up and running
2. Create a secure group to allow incoming traffic from a Foglight machine
a. I have created a group called Quest-SecureGroup, where I have opened ports required to allow incoming connections from Foglight Agent Manager's public IP-Address. Note: same secure group can be used on other AWS EC2 Windows instances in case of monitoring more machines
b. Allow RPC Port range, WMI, WinRM-HTTPS/HTTP, RDP will set as default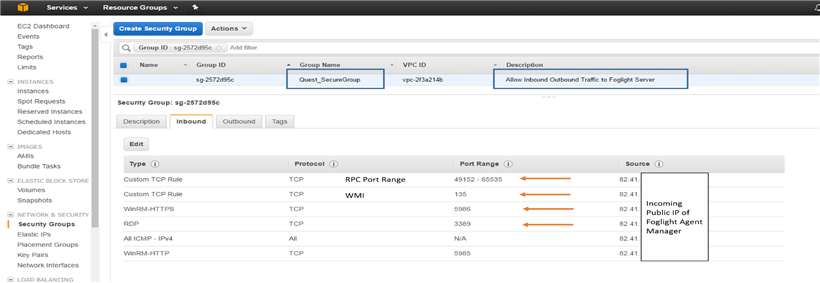
c. To chane security group | Select the machine | Actions | Change Security Groups | Select "Quest_SecureGroup" | assign to machine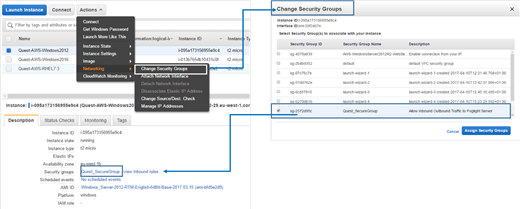
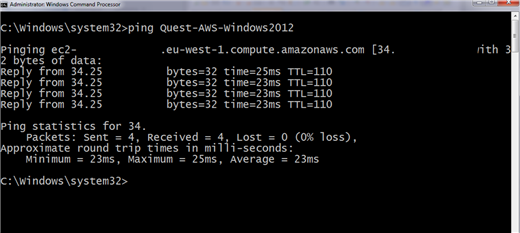
3. Check if the host can be pinged on hostname from the Foglight Agent Manager
a. Add the details to the hosts file of Foglight's Agent Manager and it may look as follows: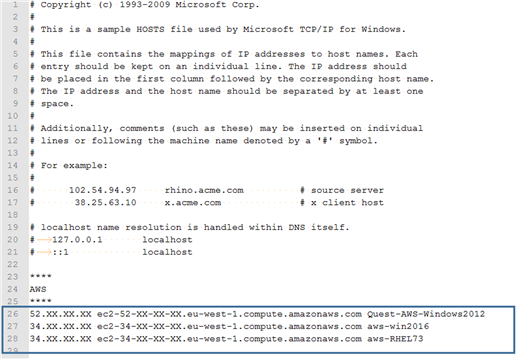 b. Check if the machine can be pinged from Foglight's Agent Manager
4. Credentials Details needed
a. Hostname
b. Username (that is part of administrators group)
c. Password
Configure an agent
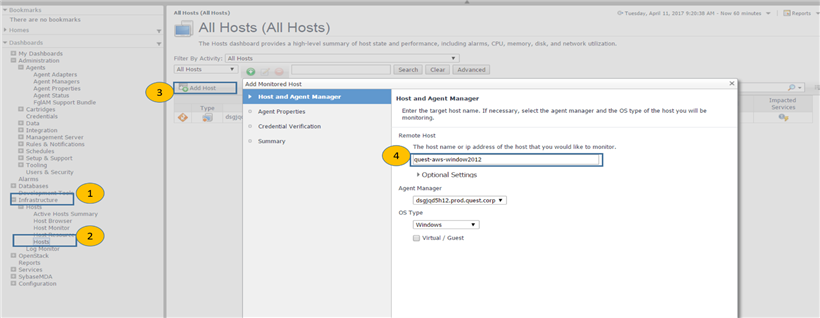
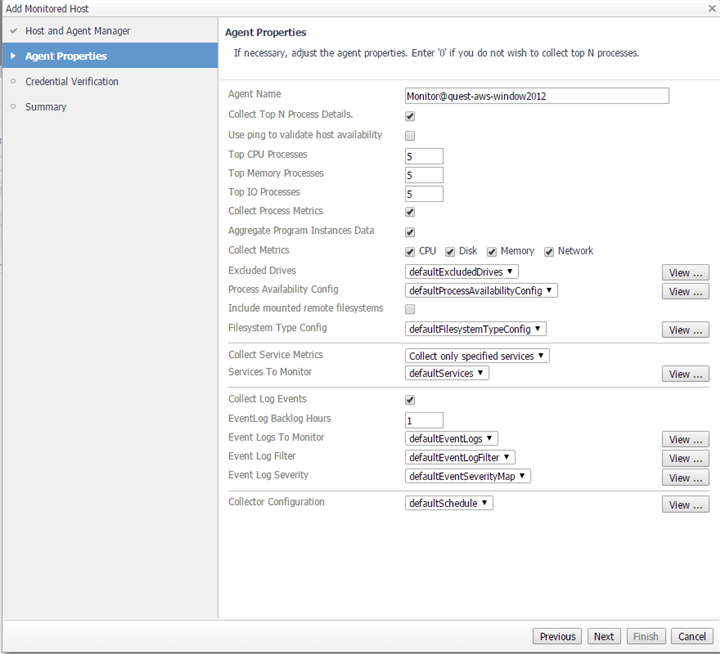
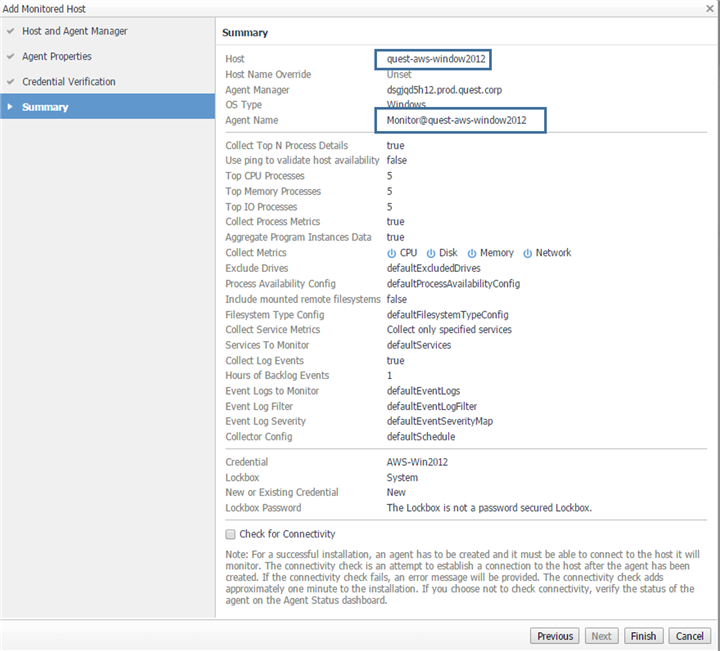
1. Go to infrastructure | Host | Add Host | Provide hostname | Click Next
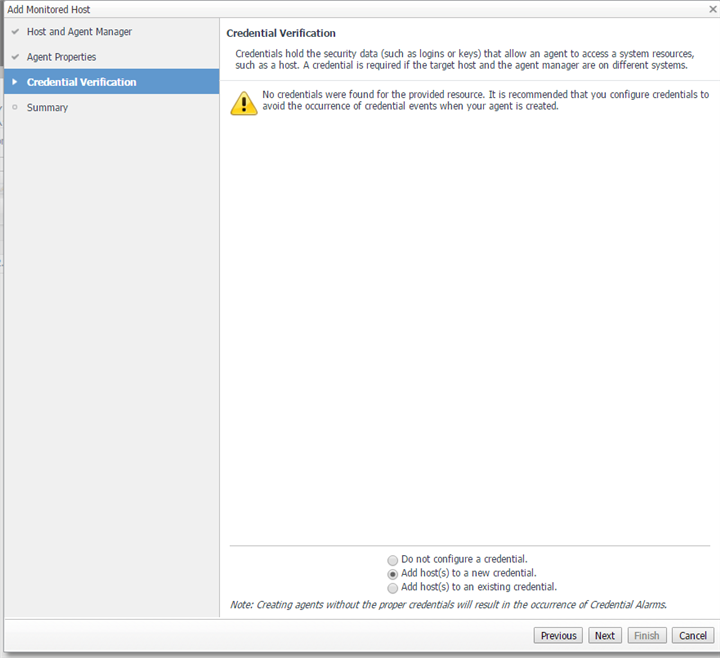
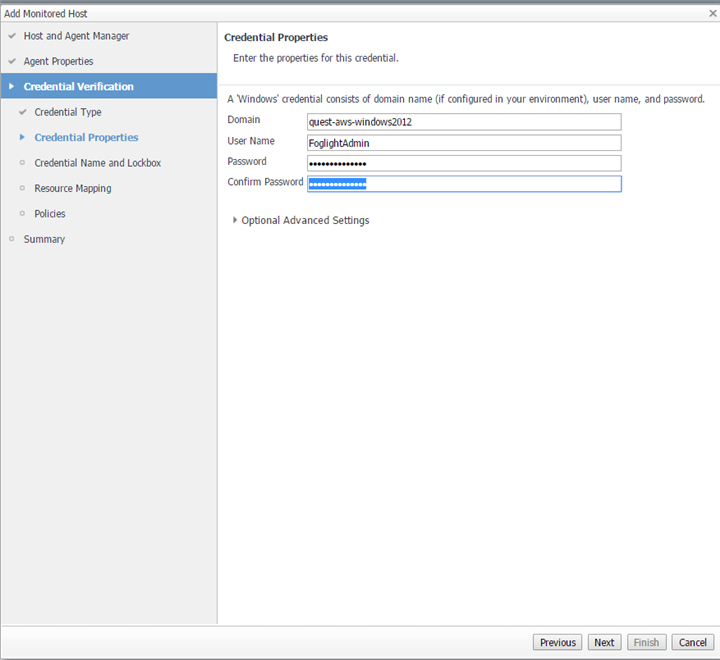
2. Add credentials to the host
Monitor EC2 Windows Instance
1. Go to Agent Status page to view - Agent created and configured
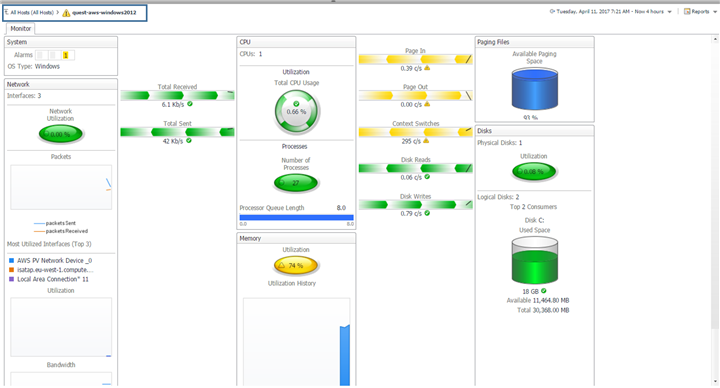
2. Go to Infrastructure Dashboard | Hosts to view all hosts - click on the AWS host to drill into for details metrics
3. Host Detail View
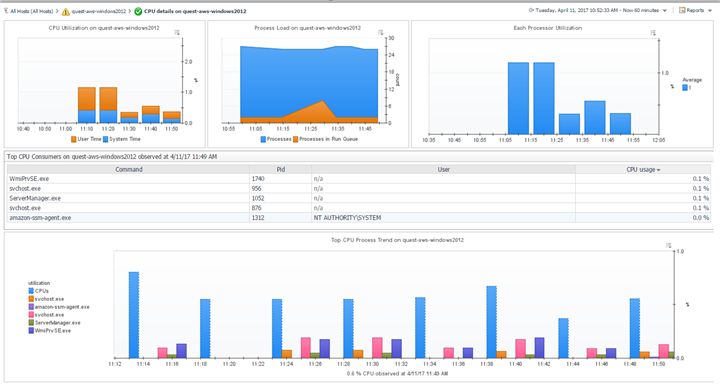
4. Click on CPU spinner to view CPU Utilization in detail
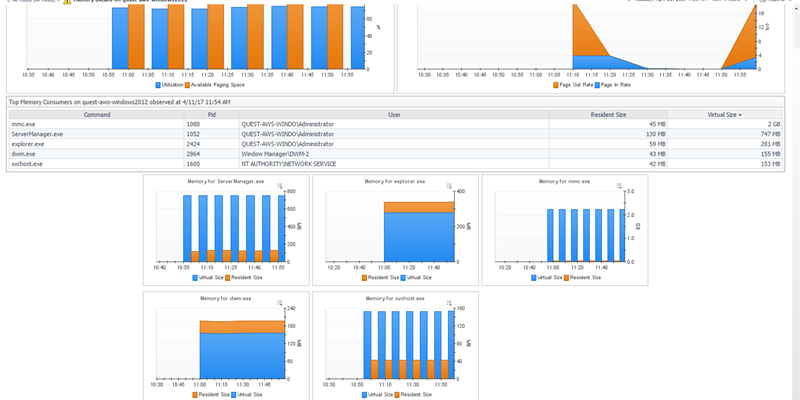
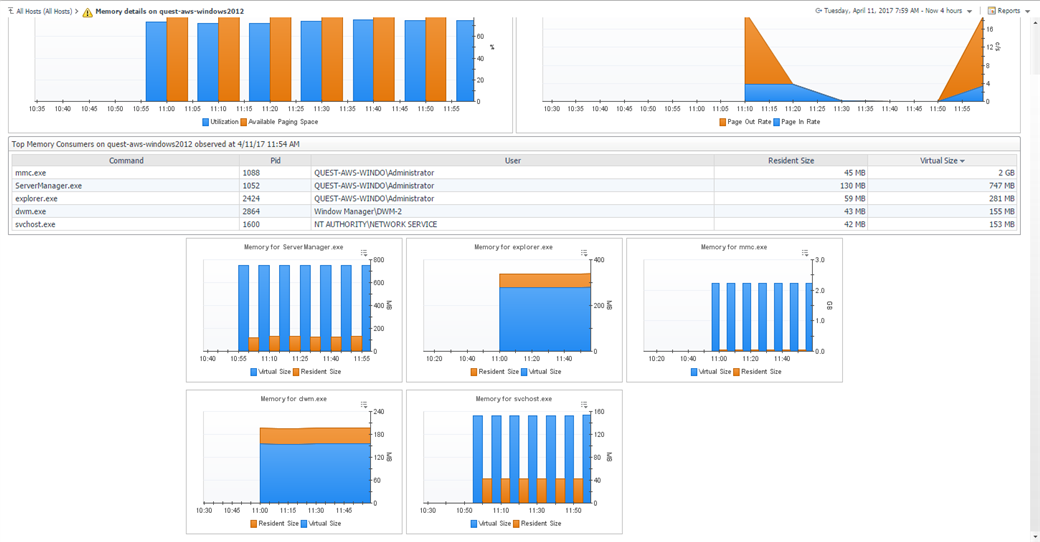
5. Click on Memory Utilization to view detailed picture of utilization, top memory consumers
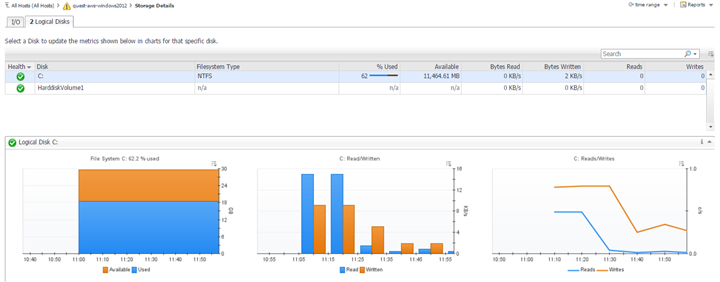
6. Click on Physical Disk Utilization to view detailed picture of Disk Utilization and I/O
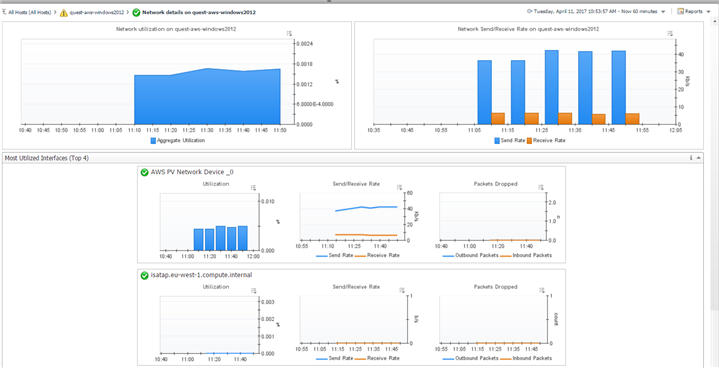
7. Click on Network Utilization to view - Overall network utilization and also most utilized network card


