
IT Administrators need to keep an eye on Availability, Performance, and Storage of mission-critical environments.
There are many things to consider as you develop a Monitoring and Diagnostics strategy.
Items to consider include:
- All-in-one or Specialized?
- Build vs Buy
- Real-time diagnostics vs 24x7 monitoring
- Architecture: Agents? Overhead? Flexibility?
- Configuration: On-prem? Cloud? Hybrid?
- Alerting, Notifications, Actions
- How do I determine what is ‘normal’ activity?
- Advisories / Troubleshooting Suggestions
- Document / Communicate
All-In-One or Specialized?
(Click on images to enlarge)


When it comes to selecting a software solution, there is a tendency to lean towards a ‘one-man-band solution’ that empowers users to ‘ do it all ’. Though there are some efficiencies to gain this way, more often than not, each item addressed suffers a bit. This guitarist on the right is likely going to perform with more precision and accuracy than the one on the left. So, too, is often the case with monitoring solutions. It is certainly possible for a monitoring solution to properly monitor several aspects to an environment…but there is a lot to consider…applications, databases, the underlying hosts, virtual environments, middleware, storage arrays…and so on…but the more you include as a requirement for that one solution…it can create friction…and very often dilute areas of concentration.
In other words, it is important to identify the correct SCOPE.
As you consider and add more requirements, you’ll need to get buy-in from more stakeholders. And again, as you need a solution to do more…details for particular areas of focus may suffer.
To take the analogy a bit further, the more musicians and instruments you have, the more challenging it can be to be “in concert” so to speak.
So, it helps to identify not only what needs monitoring but also, what items to be monitored are most closely related and with whom and/or what other groups will you need to be and stay in concert with...
A DBA likely needs detailed information about databases but also likely the underlying Window and/or Linux host information. VM metrics may be important too but for a DBA how much VM detail do you need versus that of a VMWare Administrator?
In my experience, Application Monitoring solutions often try to monitor everything…but often fall short in particular areas.
So, again, find the correct SCOPE for a monitoring solutions’ capabilities.
Build vs Buy
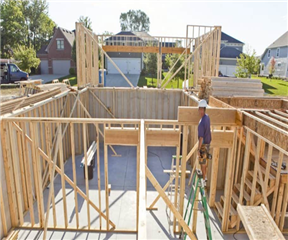

I’ll use another analogy…this time, a house.
There are lots of pluses and minuses to both build and buy…but the things to consider are similar to that of build vs buy for a monitoring solution.
With Build – The big advantage is that you can customize the house to your heart's content. I want a roof with 4 gables. I want 18 windows. I want a basement. I want hardwood floors and so on.
In doing so, what is it that you also have to weigh into the equation?
Build resources that will likely be affected include...
Time:

Money:

With a monitoring solution, build equals either home-grown scripts and/or internally-developed custom applications.
Now, moving away from the house analogy, there are added considerations…
- Mind-share - What if the person or people who wrote and maintained the scripts and/or custom application leave(s)?
- What about all of the updates that may be needed if/as new versions of what you’re monitoring (say, a new DBMS version) are introduced? These new versions may require rewrites to your scripts or internally-developed applications.
Real-Time Diagnostics vs 24x7
Depending on your requirements for level of support, real-time diagnostics tools may be all that certain environments need. Run scripts and/or open that client-side utility to investigate what is going on right now. They can be very effective and sometimes enough. That said, to know that there is an issue happening, unless you’ve just run those diagnostics, this method often relies on getting feedback from the end-users (internal or external)…and them sharing things like…”I cannot connect” or “things are slow”
With 24x7 solutions, there will be a bit more to the architecture (and likely higher cost), but you won’t miss anything because 24x7 solutions typically offer…
- Alerts (visual)…but also, Notifications e.g get an email if a problem arises
- A Repository, to hold historical data. Often, the GUI allows for pulling data from a historical window of time to understand what happened in the past. Sometimes, there is a means to query that repository directly. This provides a way to stay ahead of potential issues/be proactive in your monitoring strategy.
Architecture
Here is an example of a monitoring solution architecture.
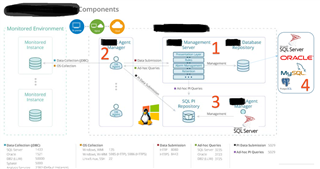
There are a number of items to consider specific to a software solution’s architecture.
- Does it cost money per component? To add components?
- Is the architecture flexible? For example, how does it work with a DMZ? What if there are multiple domains? Are there upper limits to what can be monitored?
- What is its resource consumption?
- Traditional Agents? Do software, services, or binaries need to be installed on what you want to monitor? If so, that invasiveness can have implications. There might be additional overhead. You might need to engage other business stakeholders...like get approval and access to install the agents. These agents will need to be occasionally updated.
- What about the monitoring solution’s GUI? Is it a thick client? If so, that means you’ll need to install client-side software wherever you want to view monitoring metrics as opposed to a web-based client. The look and feel between the two (thick client vs web-based) is personal preference but with a web-based GUI, all you need is access to a web browser.
Configuration: On-prem? / Cloud? / Hybrid?
1. Is what you want to be monitor on-prem? Is the monitoring solution installed on-prem?
2. Is what you want to be monitored in the cloud? Is it IaaS? PaaS? Is the monitoring solution able to be deployed to the cloud? Do you want/need a SaaS model for your monitoring solution? Is that deployment option available?
Alerts

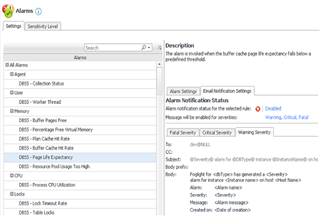
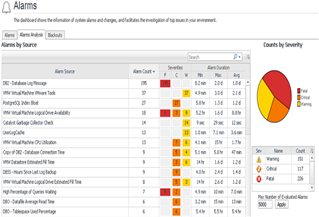
Most monitoring solutions offer Alerting capabilities. Thresholds can be defined and if that threshold is crossed, the alarm fires.
What is important to realize, though, is that some solutions do not offer this capability out-of-the-box. In other words, it requires a lot of front-end set-up work to get a usable monitoring solution. In that time it takes to set it up, you may be missing important activity...activity causing issues in your environment.
These alerts are typically visual alerts. It is typically in the form of various colors, yellow, orange, red…signaling the severity of the threshold crossing. That’s helpful for staying abreast of potential availability and performance problems. But, what if you don’t have the solution’s GUI open and actively looking at it?
Notifications and Actions

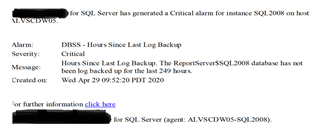
This is where the concept of Notifications and Actions comes into play. It is important for monitoring software to support/perform these capabilities.
A threshold is crossed and an alarm fires. With notification capabilities, you can get an email or a text message to be made aware of the issue when you aren’t actively looking at the monitoring GUI (which is likely more often than not).
Actions can be equally useful. Some monitoring solutions allow for an action to be initiated. For example, a threshold is crossed, an alarm fires and you can have it configured to run a corrective script. Or, kick off an SNMP Trap to work with a Ticketing system like Remedy or ServiceNow and have the alarm initiate a ticket.
These are ways to be more proactive and stay ahead of issues.
Baselines
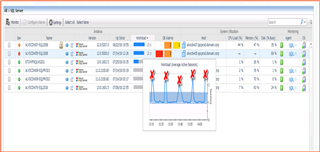
Conceptually, we are all familiar with the idea of baselines. It’s a minimum or starting point used for comparisons or a fixed reference point. Consider a monitoring solution that generates and maintains baselines. Why are baselines important? It establishes what is considered ‘normal’ activity for that time period. That way, it is easier to identify what is abnormal activity, and therefore, potential issues can be more efficiently identified. You may find that sometimes, the term baseline is used loosely and is only a comparison of earlier windows of time. But, that’s really trending versus baselining. Baselines can be generated or learned in a number of different ways. Algorithms may be run periodically. Machine-learning could be leveraged. Or, even AI could be implemented. An added beneficial capability is for the monitoring solution to be able to alert you if workload activity starts to behave abnormally. So, for example, it is useful to be alerted if say, CPU spikes to 90%. However, it has more context and it is more actionable if you also have the information that for that particular time period that CPU is normally 50%. Or, conversely, CPU is normally 90% for that time period. The latter is probably less pressing. It may not even be a problem. Rather, it is the expected workload for that time.
Advisories / Suggestions
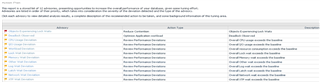
Whether you are new to the field or a seasoned IT professional, most everyone welcomes troubleshooting suggestions. Look for a monitoring solution that offers this as not all of them do. It’s best if the suggestions are specific to flagged activity. These are sometimes referred to as ‘Advisories’ or a similar name. They describe the flagged activity, provide some context around the potential issue, and offer suggestions as to how to administer and fix the problem. Often times, there is more than one potential cause and therefore more than one suggested remedy. This is another example of how your monitoring solution can provide efficiency gains.
Reports and Custom Dashboards
Lastly, it is important to consider if you need the ability to both document performance metrics and/or share that data with other stakeholders at your company. If so, the monitoring solution needs to support this capability. More specifically, find a monitoring solution that offers this capability. But there’s more to this concept. Find out if the solution offers...
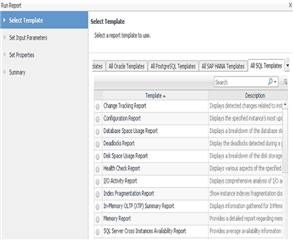
- Out-of-the-Box (OOTB) reports - These are handy to save time and generate well-formatted reports quickly. Also, it's ideal if these reports can be scheduled and emailed.
- Custom Reports - These can help to address documentation and/or communication requirements with specific content.
- OOTB Dashboards – Monitoring dashboards are nothing more than categorized displays of metrics. Some solutions claim to support monitoring virtually any source but here’s the catch. Many of these solutions require that you build out these dashboards yourself with no OOTB dashboards available. A question that then comes to mind is…Then what are you paying for? From both a value and efficiency standpoint, OOTB dashboards are something that you should demand. Otherwise, you’re not all that far from the Build option described earlier.
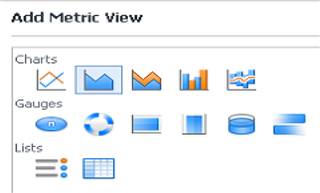
- Custom Dashboards - Not unlike custom reports, custom dashboards provide the power and flexibility to build them out with your own customized content but also customized display of those metrics. Choose from a table, graph, chart, real-time spinner, volume cylinder, and so on.
Either way, OOTB or custom, these dashboards should be considered a step better than reports when it comes to monitoring data. Why? Well, monitored data is always changing. The data may be hours, minutes, or even seconds from having new values. Reports are static which means the report content is going to become stale and often, fairly quickly. With dashboards, the data is being refreshed in a repetitive fashion. So, the data is more meaningful. It is up-to-date. It’s as real-time as the last time the data was retrieved. We all know that important decisions are best made when the data is current and therefore, relevant.
And finally, the ease with which these custom dashboards can be shared is critical. The creation of Custom Dashboards is ideal for providing subsets of data to different groups in the enterprise. Maybe the Storage Administrators simply need those 6 critical storage metrics. Maybe Management only wants summarized trended data. That can create communication synergy between those groups. How about simply sharing a link to that web-based dashboard? It cannot get much easier than that. It’s possible and available with the best monitoring and diagnostics software solutions.
Hopefully, the contents of this blog serve as a checklist of sorts of the important items to consider as you plan your environment’s monitoring strategy.
Consider evaluating Foglight when planning your monitoring strategy. For more information, visit Foglight database monitoring and download a free trial.
