
Hello all. I am a sales engineer at Quest, so I assist customers with Foglight for DB2 installations and evaluations. People who manage performance of DB2 databases need a view in Foglight listing those SQL statements that have been the largest resource consumers, and large per-execution resource consumers, over a time period. Until the latest release of the DB2 Cartridge, release 5.9.4.10, the "Top SQL" view was the Foglight visualization of top DB2 resource consumers. That view, however, displayed (helpfully) the statements that had run the most and had used the most resources since the DB2 package cache had been flushed or the database had been started. That view did a nice job of showing which SQL statements had proven to have the largest cumulative impact on the DB2 database resources. But, the amount of resources or execution time of a statement in a particular time period was not its focus.
In release 5.9.4.10, along came the "SQL Performance" dashboard, bringing some important changes to Foglight for DB2 for analyzing your workloads:
- The metrics for each statement are values for the chosen time period, not cumulative values for an unspecific (perhaps quite long) period.
- Choose any time period for the dashboard to see what the top statements have done during that period.
- The look-and-feel of the dashboard is updated using some UI characteristics that you might have already seen in Foglight's SQL Server and Oracle Performance Investigator SQL Statement workload views. See screen captures below.
- The Top 25 statements (initially chosen by total execution time) are displayed in the SQL list.
- Sorting by another of the view's data columns will display the Top 25 by that new criterion.
Some benefits of this view:
- Save investigation time. When its been suggested that "DB2 was causing problems" yesterday afternoon between 2:00 PM and 4:00 PM (or last week Tuesday during some time range, etc.). Save diagnostic and resolution time by seeing those statements that had the biggest impact on that time period, and focus your investigation/tuning efforts on those.
- Improve the SQL statements that matter most. Use Quest's SQL Optimizer for DB2 tool or some other way to tune the resource consumption of the statements that have had significant impact on resources (and perhaps on throughput of other workload) to see the biggest performance improvements of applications that use the DB2 database.
- Investigate workload abnormalities and waits quickly. Study workloads executed during times in the past and see trend graphs of key metrics for that time period, including baseline deviations (what's abnormal about this time?) of work being executed and relative amounts of time on specific types of wait events that your workloads were facing.
- Learn about the workloads generated when application changes move to production. What issues seem to be caused by the introduction of these new queries running against our database?
The screen captures below show examples of the SQL Performance dashboard.
First, I got there by clicking the menu bar option, "SQL Performance". The navigation tree on the left is initially set to "Partition View". Expand that by clicking on the "+" button and you will see the "SQL Statements" dimension. From there you can choose any SQL statement in the list by clicking on it, displaying performance metrics about it on the right.
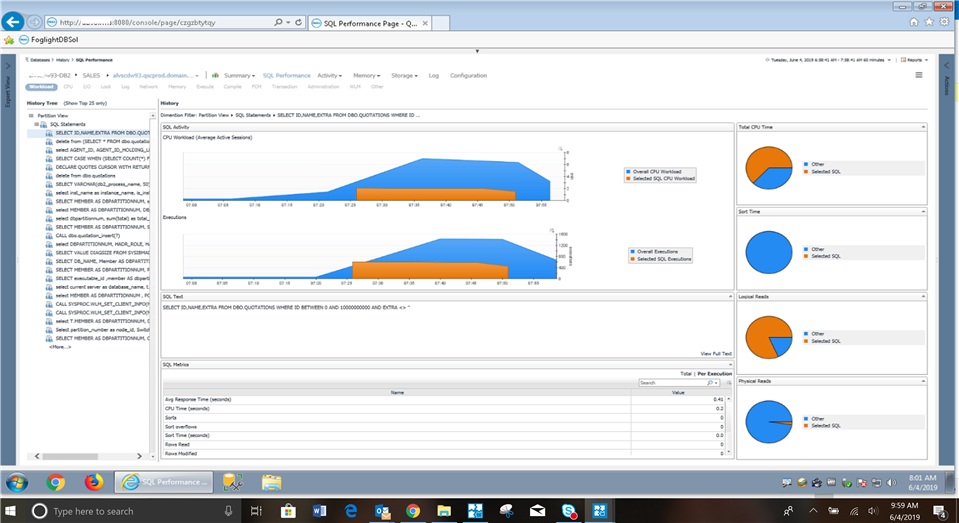
Above, this view has the "SQL Statements" dimension on the left expanded to list the SQL statements in order of total active time for the chosen time period. The first statement in the list has been highlighted, and details for it are displayed.
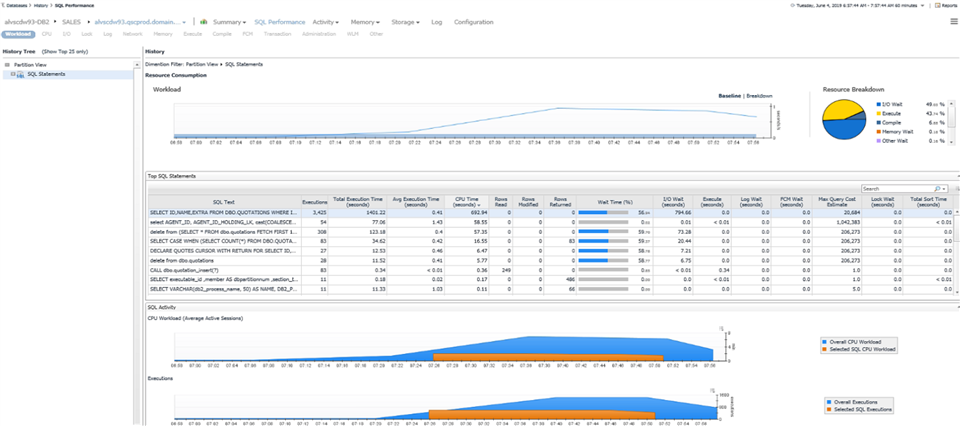
Above, this view is showing the SQL Statements dimension, so cumulative activity/metrics for the workloads during the chosen time period.
I would much appreciate hearing from you, once you've upgraded your Foglight DB2 cartridge to release 5.9.4.10. Please do share what you think of this new "SQL Performance" dashboard. Share your questions and feedback by responding to this post, or enter them into the discussion forum. We hope the new view is helpful and answers questions for you about workload issues quickly.
