
One of the primary tasks of any DBA is to find and optimize poorly performing queries. This is not a trivial job as often times there is too much data to sort through and pinpoint problems. Quest’s Foglight provides alerts for Postgres queries that have suspect behavior.
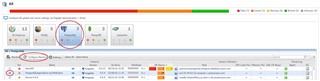
(*As of Foglight v. 5.9.3.10), Postgres alarms can be found/configured/managed here:
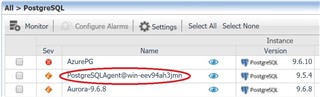
Navigate to the instance(s) you’d like to manage by checking the box(es) to the left of the instance name(s). With appropriate Foglight privileges, the ‘Configure Alarms’ button will be enabled. Select it.
(Click on the images to enlarge)
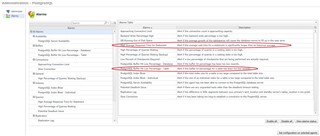
Two particular Foglight alarms can offer quick insight into queries that may need a closer look.
High Average Response Time for Statement – This alarm fires when the average wait time for a statement significantly exceeds that of its historical average.
PostgreSQL Buffer Hit Low Percentage – Table – This alarm triggers when the buffer hit percentage for a table is low.
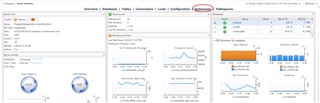
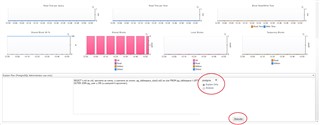
Back on the Foglight database home screen, click on the instance name to access the Overview page.
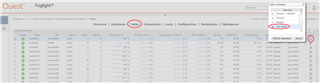
From the Overview page, drill into the Statements page.
Find queries taking a longer amount of time to run and/or find those statements with low hit percentages (a result of long-running statements). Postgres tracks patterns of data access and keeps frequently accessed data in cache. It’s best to keep a cache hit rate of about 99%. Consider increasing the cache available with a ratio significantly lower.
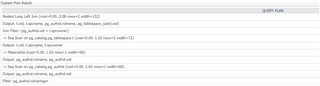
Select the query to go to the Statement Details page. At the bottom of the page, there’s an option to request an Explain Plan to better understand the query steps and how long each step is taking for tuning purposes.
* Explain and Stat Reset requires Postgres Administrator privileges.
Additionally, check for indexes on the associated table via the Tables page.
If/when changes are made to the table structure or query and you are ready to test performance, you can reset statement tracking statistics and display new performance data.
Select the Admin button and select Stat Reset.
For more information, visit Foglight database monitoring to download a free trial.
