

Merriam-Webster defines ‘Custom’ as made or performed according to personal order. Tailored, fitted, personalized…or ‘pimped out’, slang meaning something is modified to extreme performance. There was a television series called Pimp My Ride produced by MTV showing cars being customized to the nines. Anytime someone explains to me that the item or service I am going to get can be customized, I have more confidence in it and take satisfaction in that option to modify.
Enter Foglight. Foglight can serve as your database monitoring platform. The data it collects is displayed in a web-based interface with various drill-down screens. One of the primary functions of Foglight is to quickly highlight and define problem areas within the monitored environment.
Let’s break down a few key elements in an effective monitoring interface. The display should be intuitive. It should be readable, easily interpreted, and effortlessly navigable. The rub is that implementation of those essential ingredients for a user-friendly interface are in many ways personal preference. Some users prefer raw data in a table or list format. Others best consume data with pictures like graphs or charts. It depends on the user. It also often depends on the type of data itself….a ‘spinner’ icon may be best to illustrate CPU activity versus a volume cylinder to communicate storage availability.
Foglight offers the ability for users to create custom dashboards. There are several use cases why this can be useful. Here are two examples. As users of Foglight become familiar with the solution, they start to understand those performance metrics that are most helpful to them. A couple of those statistics might be in one drilldown page and a few others may be located in another drilldown and so on. With Custom Dashboards, users can create a single go-to interface displaying all of those favorite performance counters on a single screen. Another reason users may want to leverage custom dashboards is to organize subsets of data for particular stakeholders or end-users across the enterprise. Storage Administrators may only need storage-specific data. Management may only choose to see summary data. Custom Dashboards allow for providing specific data to those users or groups. This way, these users won’t see other data that perhaps they should not see. Less and more specific data also makes for easier digestion of the information. So, in addition to creating custom dashboards for yourself, they can be built and shared amongst those various users or groups.
So, the value proposition is clear. Organize and share monitoring data for easier consumption. But the best part about Custom Dashboards is that they are a simple to build.
A Wizard walks users though the process:
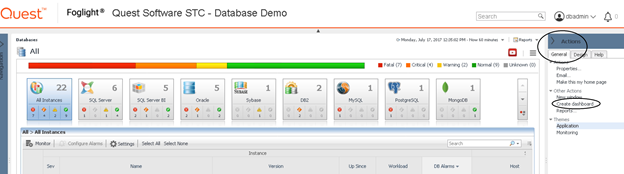
Step 1: General tab > Create dashboard
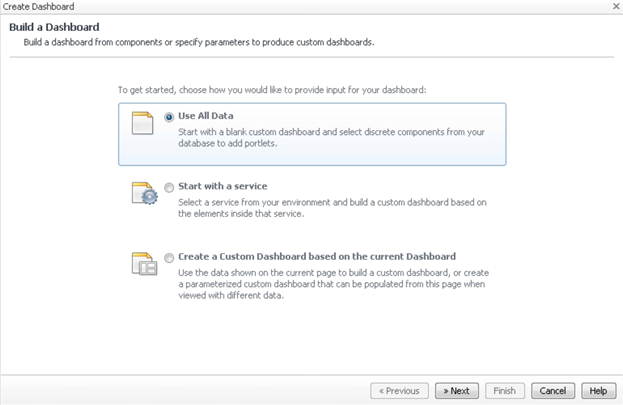
Step 2: There are three options but to start new, choose Use All Data > Next
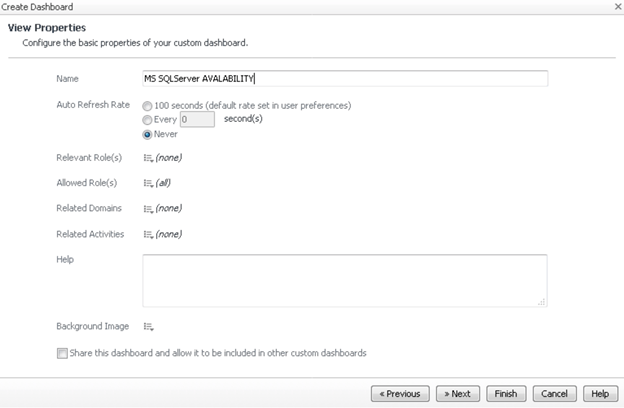
Step 3: Name the dashboard, choose a refresh rate, choose who can have access > Finish
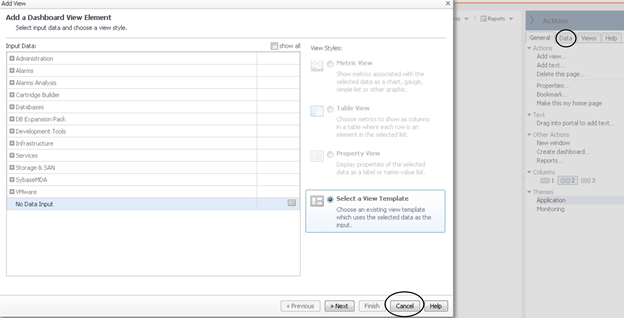
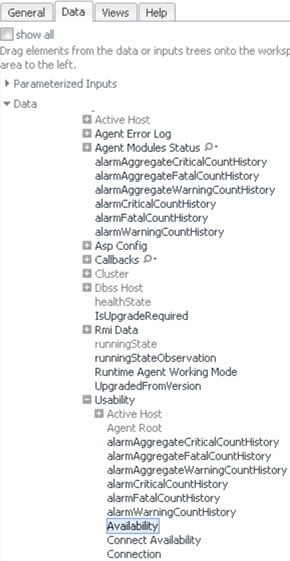
Step 4: This screen is displayed to start choosing data but I prefer selecting Cancel and then dragging and dropping data from the Data tab list. In this example, I am selecting and dragging the Availability metric to the left onto the blank dashboard.
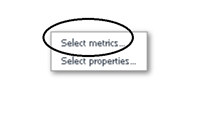
Step 5: Once the metric is dragged over, choose ‘Select Metrics’.
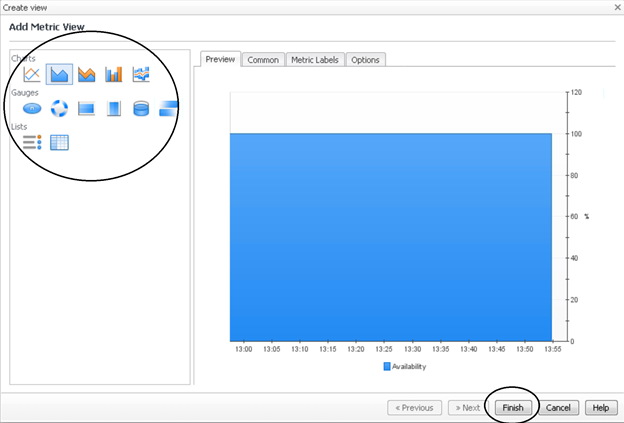
Step 6: Choose how to display the data. Note all of the available options. Since my example involves Availability data, I am choosing an Area Graph > Finish.
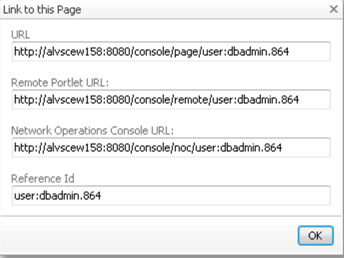
Step 7: Add as many metrics as needed. Choose the General tab > Properties > Link to this page
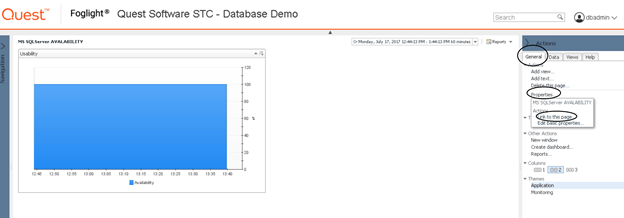
Step 8: Copy a link and share.
Done! Creating dashboards is easy. The only learning curve is understanding what data you want, what that data is named, and where it is nested within the tree.
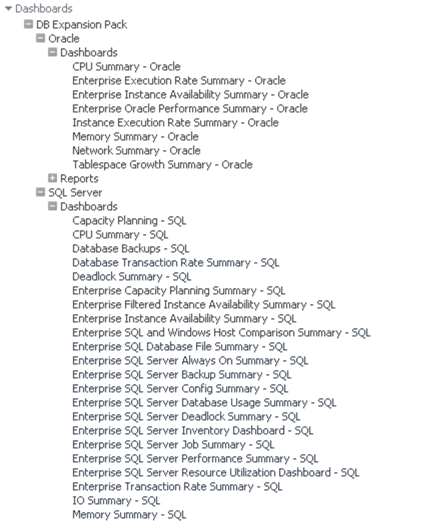
To see examples of Custom Dashboards created and shared by Foglight end users, download the Foglight database Expansion Pack here https://www.quest.com/community/products/foglight/f/custom-dashboards-and-scripts/418/foglight-database-expansion-pack
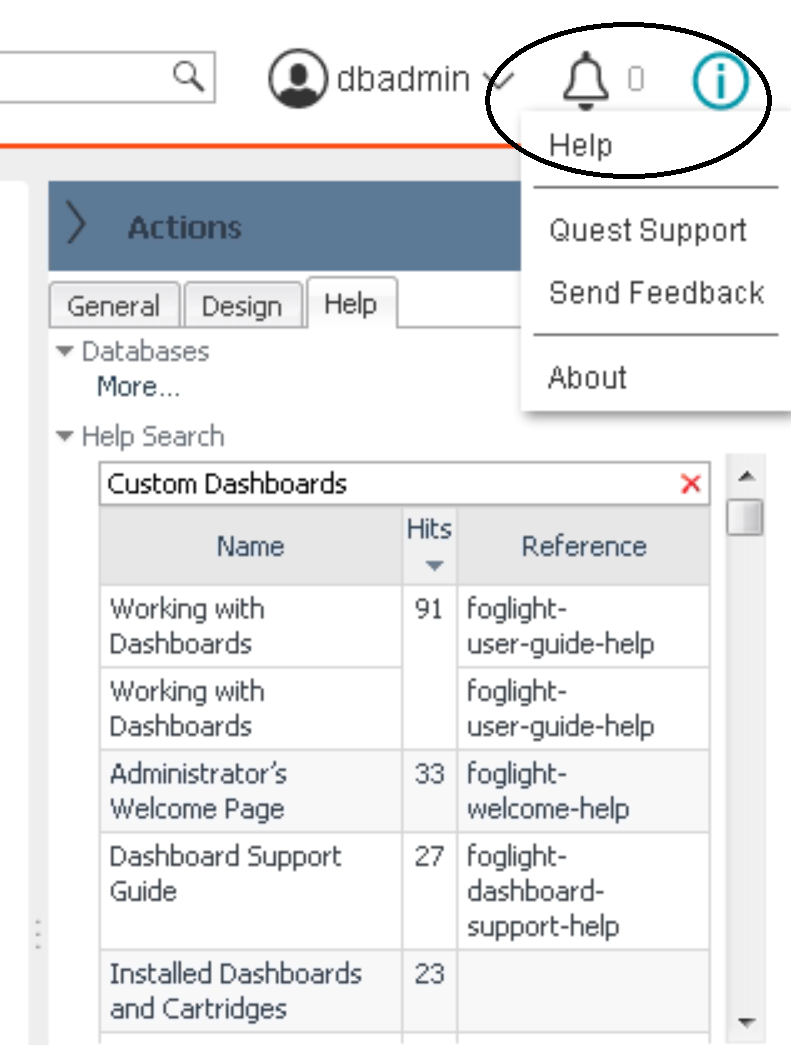
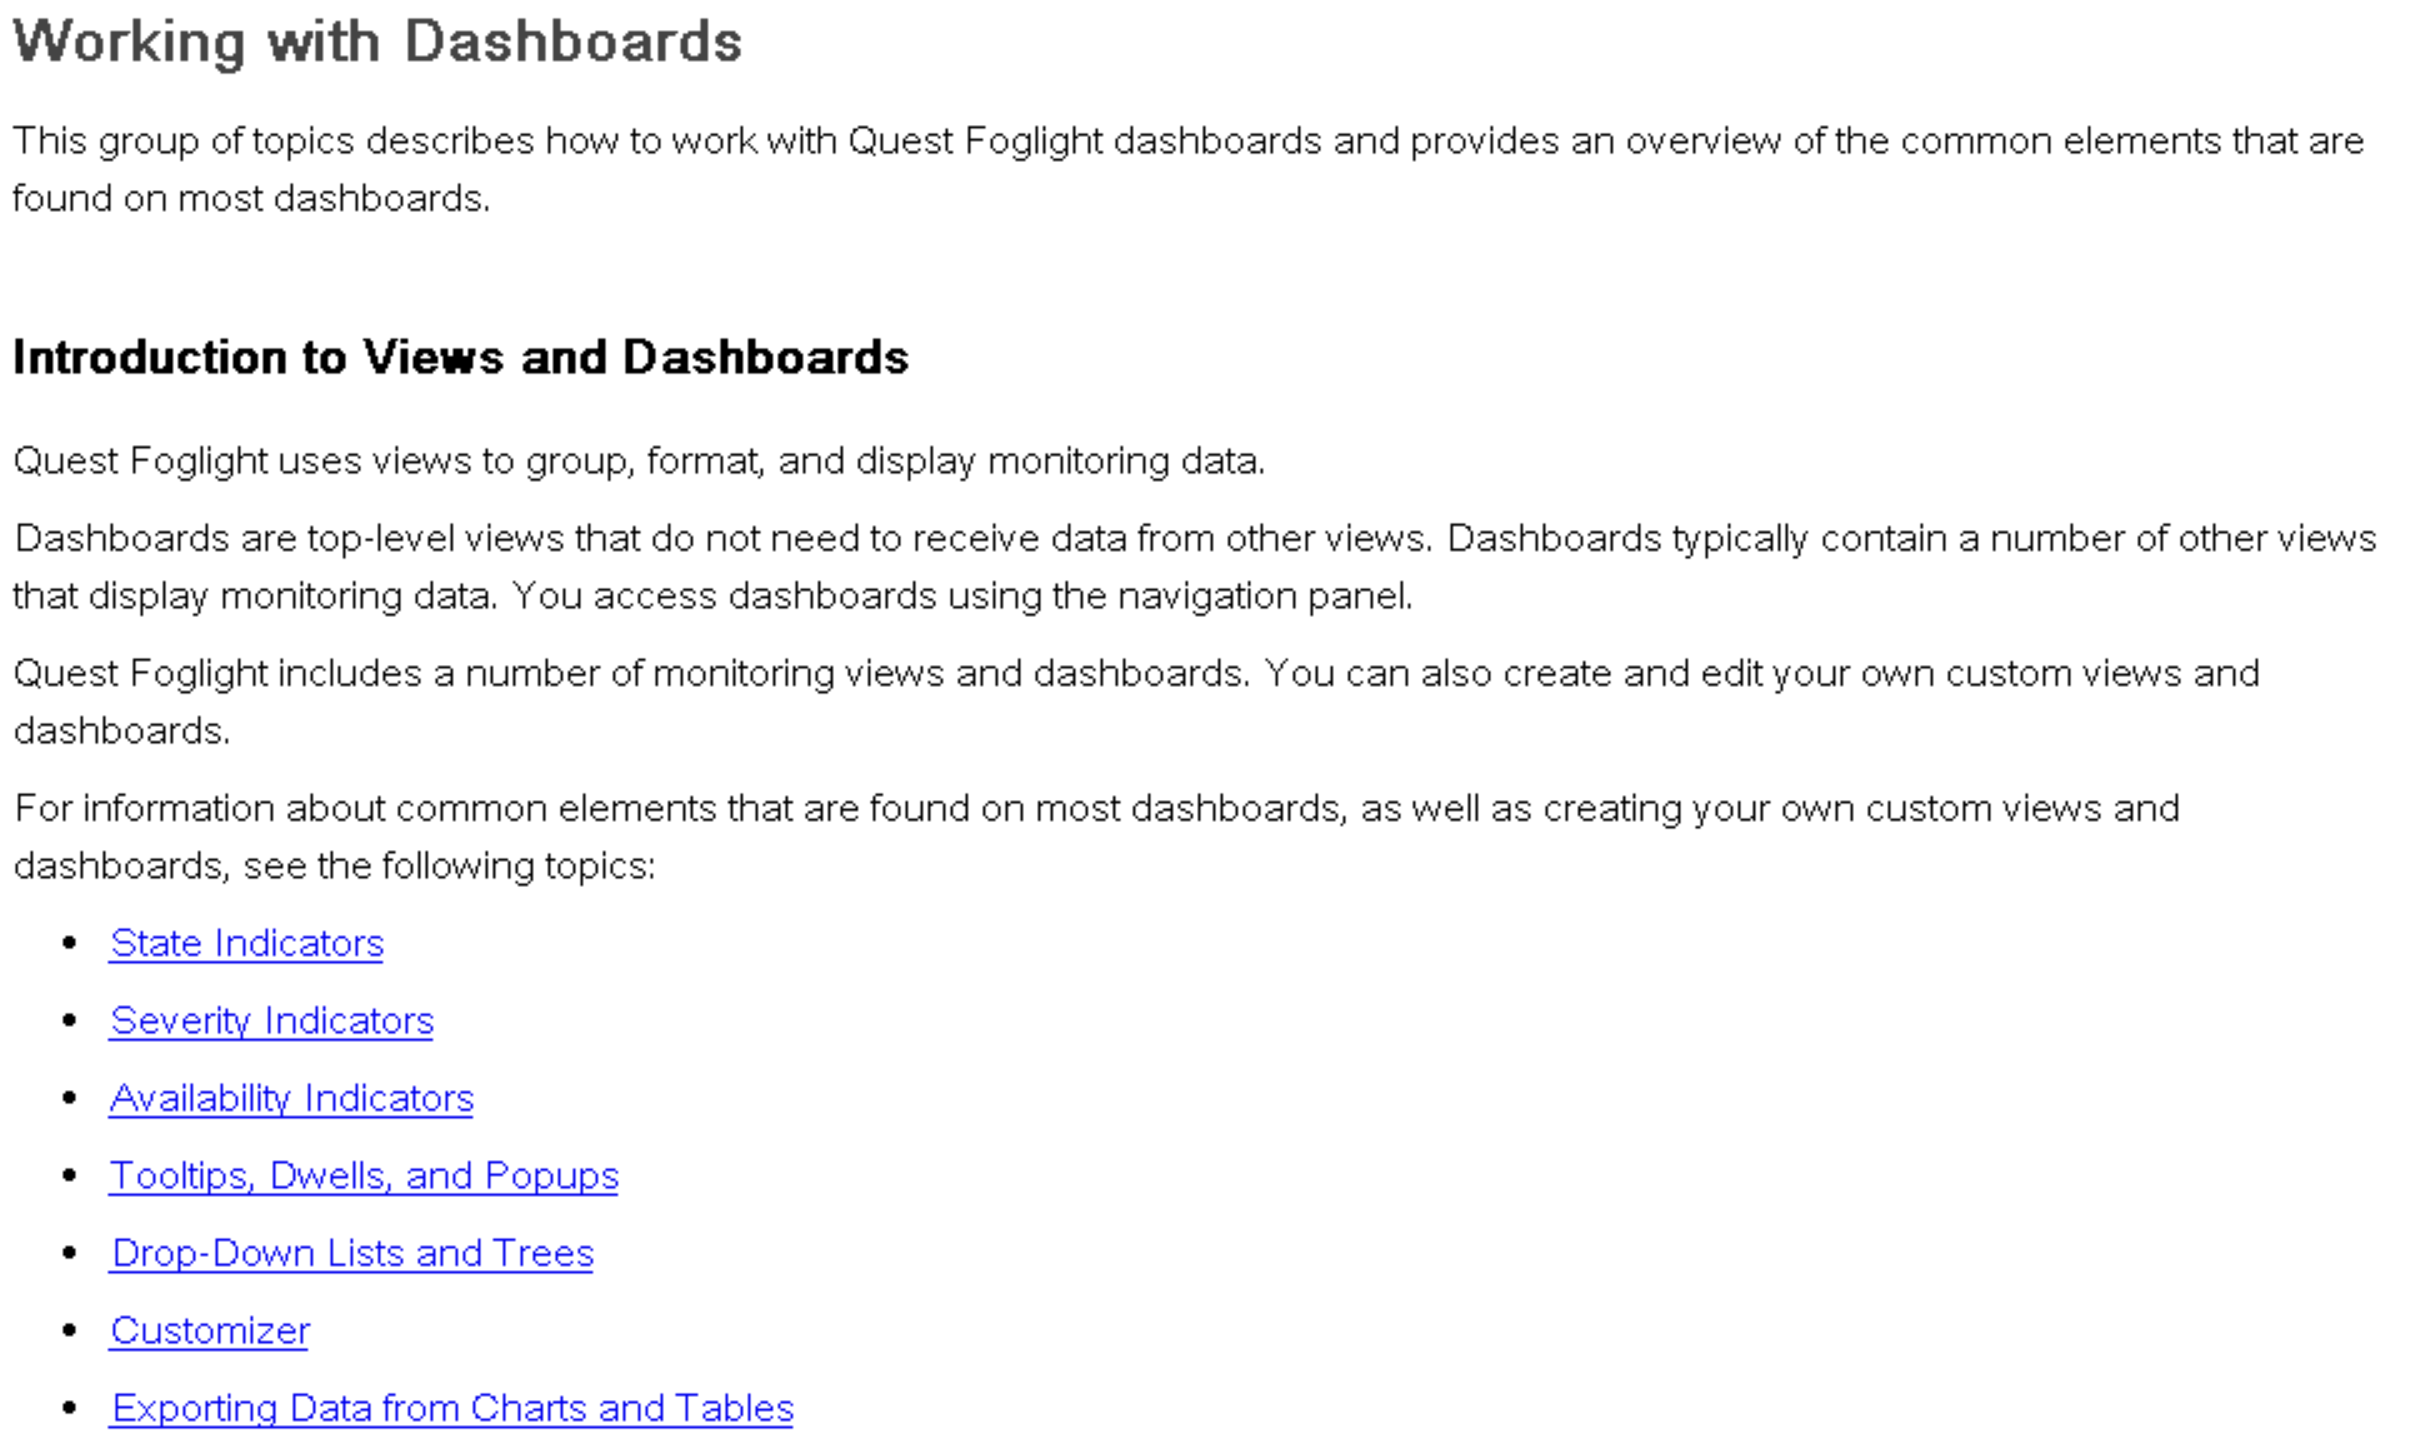
For additional guidance, use the keywords "Custom Dashboards" in the built-in Help search field.
So, “pimp out” your Foglight monitoring dashboards for easy data access and sharing.
Visit Foglight database monitoring to download a free trial.
