This is the second in a multi-part series on how to leverage Foglight to save money within your IT budgets. To review the first part, managing monitoring vendor sprawl, check out the post linked here.
This post is going to cover another way to save money, by effectively balancing resource utilization across your entire database environment. This post will focus mostly on database servers running on traditional virtual machines, specifically "on premises" in your own datacenter. A future post will cover managing cloud hosted systems.
Finding that "sweet spot" of resource utilization is really tricky. If you "under spec" the resource allocation ("hardware") of a VM, you run the risk of suffering major performance problems or worse, system instability. For business critical applications, no one wants to hear that productivity and/or reliability has suffered because we tried to "cheap out" on hardware. Because of this, I often find that IT administrators "over provision" their systems, by in some cases a pretty high amount. "What's a few extra CPU cores or gigs of RAM going to hurt?". In a small scale, its probably worth the few extra hundred to thousand bucks to give yourself some breathing room on resource allocation, but when you start multiplying that breathing room by dozens, to hundreds, and in some cases thousands of database servers, you end up with a tremendous amount of "wasted" hardware just sitting there not being consumed. When you look beyond the hardware cost, other costs can add up as well, such as floor space in a data center, power costs, and probably biggest of all, software license costs that sit on over provisioned hardware. Many software products license by core, so every extra core used, can amount to thousands of dollars per year that is unneeded.
So now that we've concluded that "right sizing" hardware resource is important for saving costs, how do we do it? It's unrealistic to assume that you are going to get sizing right from the get go. No matter how much you plan and test, real world application usage rarely matches exactly what you expect it to. Monitoring a production environment 24x7 will greatly assist in ensuring that systems are sized properly. If systems are "under sized", performance problems are likely, and your monitoring solution should alert you to this so that you can diagnose and address the problem. How how do you detect when systems are "over sized"?
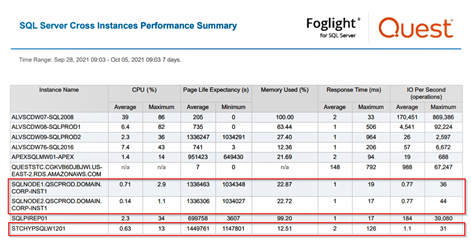
Foglight for Database collects hundreds of useful performance metrics, across all of your production database servers that can then be analyzed and reported on to determine how systems are being used. With CPU as an example, database servers that never exceed 10% CPU utilization, could be candidates to reduce their core count, or possibly even consolidate with other under utilized systems. Database servers that never console more than a trivial amount of IO resources, my be candidates to run on less expensive disk. Database servers that aren't even being connected to, may be candidates to deprecate altogether. Because Foglight is collecting these metrics 24x7, and retaining that data for months worth of history, you can be assured that your analysis is complete. You aren't missing peak periods of utilization that happen sporadically, and you have enough historical data to back whatever conclusions you come up with. Below, you can see a screenshot of an out of the box report in Foglight called the "SQL Server Cross Instances Performance Summary" report, which can be run ad hoc, or scheduled and automated. This report shows several key performance indicators, with both average and max/min values, so that you can identify servers that are over or under provisioned. I've highlighted a few servers in the report that would be good candidates for consolidation, or perhaps deprecation, given their very low resource utilization.

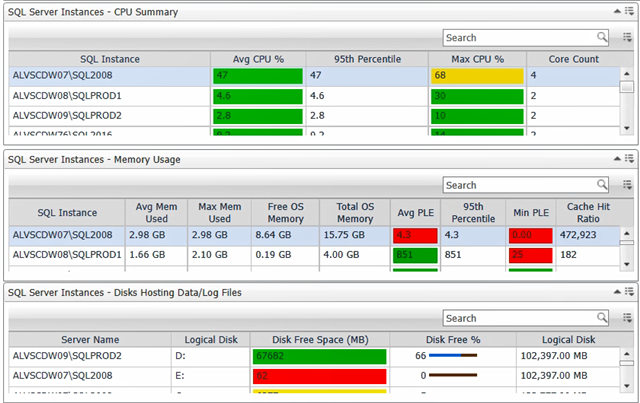
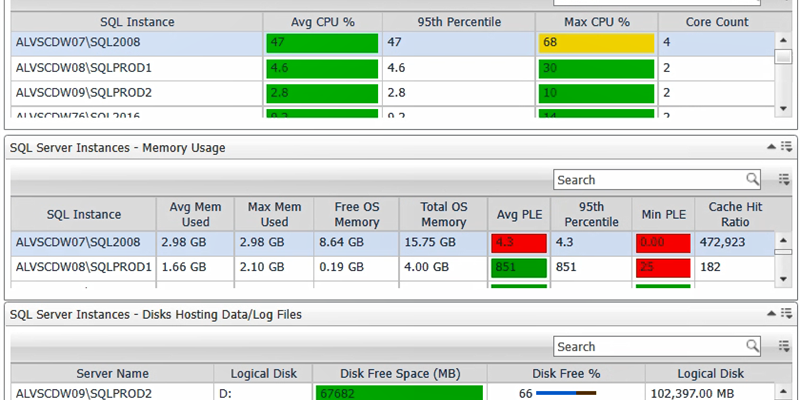
There's also a dashboard included in the Database Expansion Pack that can expose further metrics with some additional calculations, including a 95th percentile distribution of performance data. The highlighting in the screenshot is designed to indicate under provisioned instances as "green".

These are just two examples of dashboards and reports in Foglight that can assist at finding over and under utilized systems. Between Foglight's "out of the box" dashboards and reports, and the ability to create your own custom dashboards and reports, you will be able to "right size" your database resource utilization, and ultimately save your company real money by reducing hardware requirements and decreasing software license costs.
For more information, and to check out Foglight for yourself, please check out the Foglight Virtual Lab!


