Many organizations have a cloud strategy and one of which is moving your databases to cloud. If you have already/recently moved to AWS and started using AWS RDS Databases for example Oracle, SQL Server, PostgreSQL, MySQL and if you are wondering how to monitor both Database and RDS host metrics, so please don’t worry – we already have Database Monitoring support for RDS databases for all flavours (Supported Database Platforms) and RDS Host monitoring using Quest’s Foglight AWS Host Cartridge.
In this blog, I am going to share some insights on what is Foglight’s AWS RDS Host Agent, what can it do, what are its benefits, a quick walkthrough of RDS Host Dashboards that will help in problem identification and quicker resolution.
The AWS RDS Host agent monitors all operating systems of RDS database engines, and it provides comprehensive performance metrics on the system and individual process usage of CPU, memory, network, and disk resources.
The key advantage is its data visualization where it groups RDS hosts by database type, and it provides performance insight under one-hood & in-conjunction with other Foglight monitoring components. You can also correlate information across infrastructure layers & Foglight Database Performance Monitoring Solution. For each host, it shows details like instance ID, location, database engine/version, status, health metrics, system usage, network settings, and Aurora cluster (if relevant). With some basic permissions an agent can be setup quite quickly and easily.
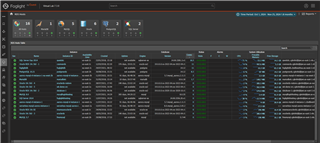
When you are on the RDS Hosts page - clicking an instance name, the RDS Host Overview provides a quick snapshot of critical metrics and settings for the RDS Host. It covers config details, availability/status checks, resource stats like CPU usage, credit balances, memory, network, and disk performance. On the right, there’s an expandable summary box listing the Top 10 active alarms ranked by severity.
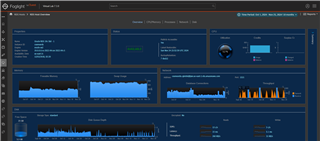
How about exploring CPU/Memory, this view is split into two main parts. The top section covers CPU stats, including utilization, a breakdown of activity, current usage. There is also a small graph that represents CPU credits which is unit of measurement for CPU performance that is consumed and CPU surplus credit when an instance spends more credits than it earns generally in a 24-hrour period. The bottom section focuses on memory metrics, showing freeable memory (memory that can be reallocated as needed) and a breakdown of memory usage by category.
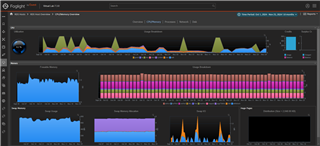
The Processes dashboard lists all snapshots captured within the selected time range. It includes process details like IDs, CPU and memory usage, thread counts, and allocation stats. The samples history can be selected to see process data for specific time periods.
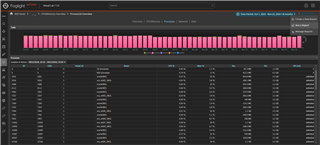
The Network page displays real-time metrics for the database instance, including the count of DB connections, network throughput, and a breakdown of network interfaces tied to the instance. Each interface shows received and transmitted traffic rates.
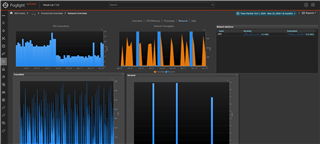
The Disks page provides a detailed overview of disk setup, storage stats, queue depth, operations, and other performance metrics, along with all linked disk devices. Linked devices include I/O and physical disks, with their performance, timing, and read/write data.
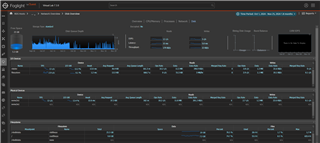
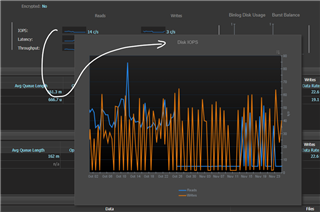
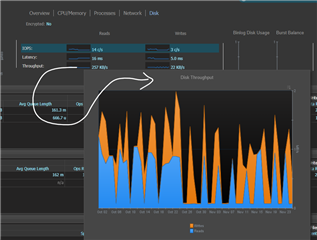
One can also dive further on some of the graphs and metric numbers, i.e. by clicking them it opens up a popup which displays detailed trends – Two examples that I like to share below are Disk IOPS and Disk Throughput
Working with RDS Host Alarms
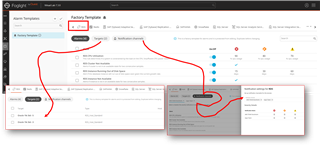
There are RDS Host alarms accessible via Foglight’s Alarm Template UI, where you can set targets and send notifications to respective team.
Setting up AWS Host Agent
To setup AWS Host agent - it requires one or more agents, and each agent is configured for one AWS region where it collects the entire RDS Stack under that region. AWS Region could be EU-WEST-3(London), EU-WEST-2(Paris), US-EAST-2 (Ohio) and so on. Please take a look at the following links below for configuring AWS Host agents.


