
We’re excited to announce that with Spotlight version 12.3, the Plan Visualizer feature now includes several new enhancements. In my last blog, I covered the Plan Visualizer feature included in version 12.0 which provides a display view of the estimated execution plans of queries captured in the SQL Activity screen.
Spotlight 12.3 has “kicked it up another notch” and has gone beyond the generation of execution plans. It now analyzes the query statements, outlines the operations included, and identifies the object names used for each session. This collection of new capabilities is intended to optimize those most frequently executed queries that drain your resources.
Let’s take a closer look at the three new features:
Analysis of Query
This new feature provides recommendations which it has determined would enhance the query’s execution time and cost. It actually provides metrics on the estimated efficiency gains. Furthermore, it identifies the top three operations of the query with the highest cost.
In the example below, the Query Analyzer shows an executed query within a batch with the following metrics:
- The query runs in 73ms
- Uses 347ms of CPU time
- Has 29568 logical reads and 0 physical reads
- It contributes to 94% of the overall batch cost
Based on its analysis of these metrics, the Query Analyzer is recommending the following action:
- Creation of a non-clustered index on the SalesOrderHeaderEnlarged table
Analysis of Query Window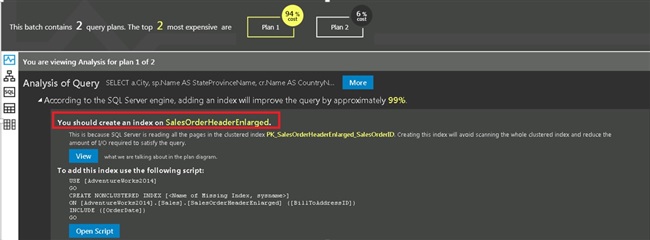
Clicking the View button takes the user directly to the Execution Plan window.
Execution Plan Window 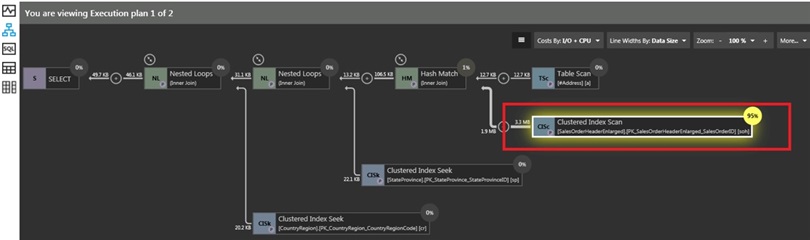
The Execution Plan view is displaying a Clustered Index Scan outputting a total of 3.3MB of data or 180k rows.
Additionally, Clicking the Open Script button in the Query Analyzer window, loads the Create Index statement into SSMS that is ready to be executed.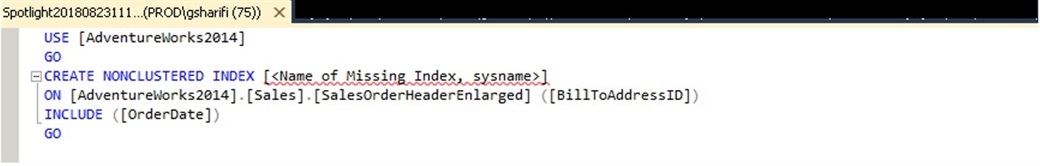
We’ll evaluate the implementation of this recommendation later on!
Operators
Another new feature included is the list of query statement Operators. The list provides statistical information such as estimated CPU and IO costs, data size, along with the predicate part of the query responsible for the operator.
In the example below, the operators used by the query are displayed along with index, table scan, loops, and sorts, etc. Additionally, it provides the estimated cost of each resource with estimated row counts.
Note the bulk of rows are under the Clustered Index scan of the table note in proposed plan.
Operator Window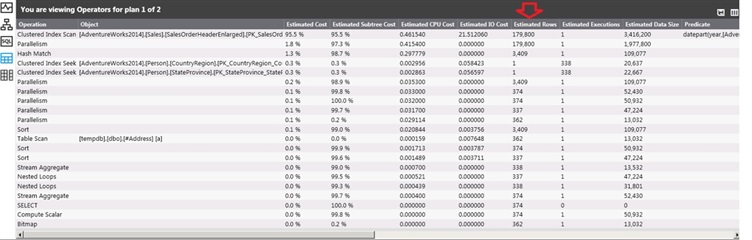
Clicking on the Export icon on the top right of the screen exports the content of data grid. The Customize icon opens up the Column Organizer dialogue. The Operators grid customizable based on desired columns.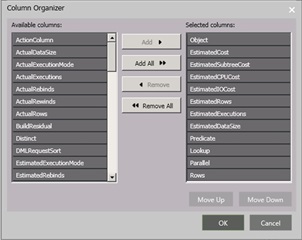
Objects
The third feature introduced in this version of Spotlight is the list of query statement Object Names. Additionally, it includes the object type, index, and associated operators. The object information also identifies the objects which are involved in my query and their associated operations.
The Object view below is reporting a table scan, one clustered Index scan and two clustered index seeks.
Object Window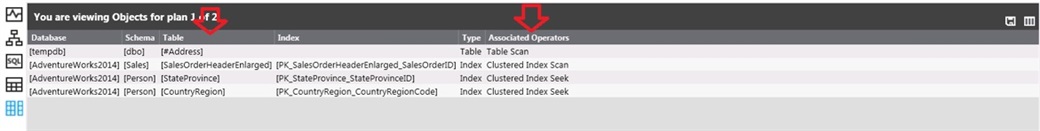
This grid is also exportable and customizable by using the Export and Customize icons.
Implementing the Query Analyzer’s Recommendation(s):
The Query Analyzer had recommended the creation of a non-clustered index to improve the query’s performance.
The initial step involved loading the generated script directly from Spotlight Query Analyzer window into the SSMS to create the index: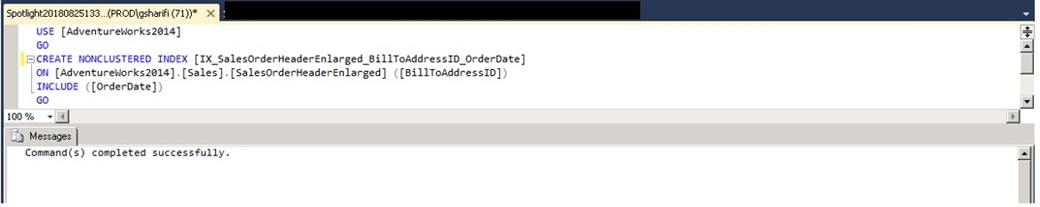
Upon creating the recommended index and re-executing the query its metrics are as follows:
- The query runs in 18ms
- Uses 15ms of CPU time
- Has 1252 logical reads and 0 physical reads
- It contributes to 45% of the overall batch cost
Analysis of Query Window (After)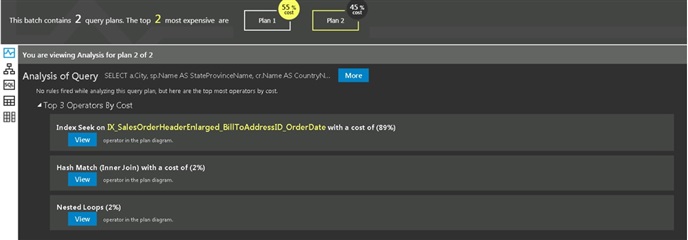
Execution Plan Window (After)
The Index Seek now only outputs 47.7GB of data and 3k rows of data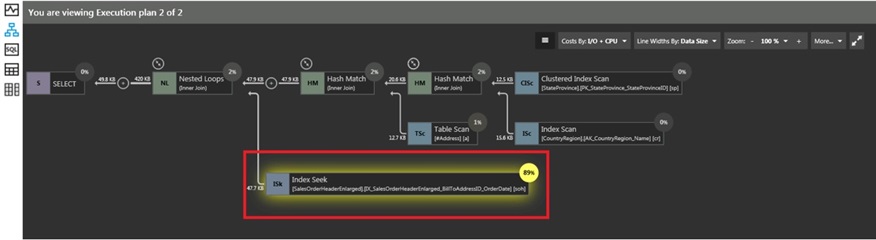
Operator Window (After)
Reduced number of operations and output rows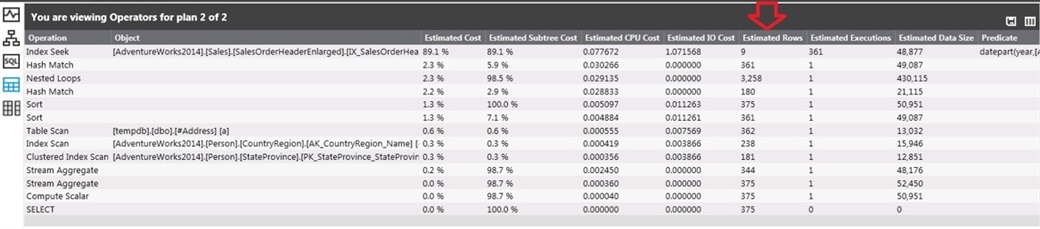
Object Window (After)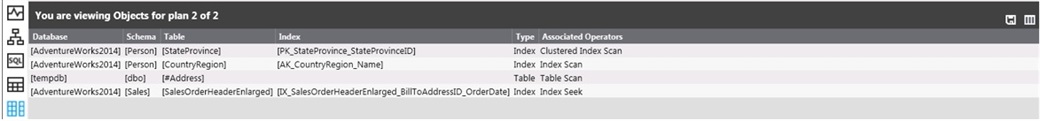
As demonstrated with the results above, Spotlight’s recommendations on frequently used and most tasking queries can indeed optimize performance and achieve tangible efficiency gains.
So, let Spotlight’s new and improved Plan Visualizer speed things up for you! Download the latest version of Spotlight from here.
