
Spotlight Enterprise 12.4 comes with some neat features you do not want to miss!
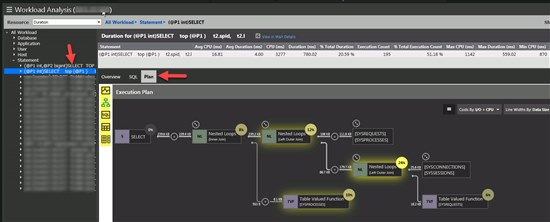
Query Execution Plans available when needed the most:
The Workload Analysis and the Query Execution Statistics drilldowns expose the most resource intensive transactions of your instance. Now, you can use Spotlight’s powerful Query Execution Plan to find problematic areas of the selected SQL. It also interprets the plan and advises on how to optimize the SQL by providing a list of objects and parameters to review. You get all of this without having to leave the page. So, check out the Workload Analysis drilldown from the Monitor toolbar of your SQL Server monitoring screen. The Query Execution Statistics drilldown can be found via the SQL Activity from the Monitoring tab.
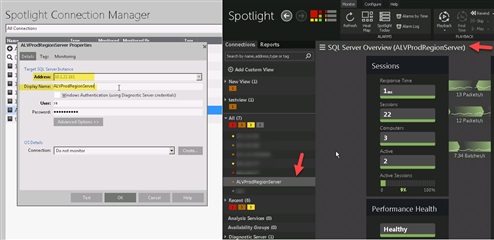
Customizable Connection Names:
Connection names in Spotlight have always been the actual server or host name that is required to establish that connection. However, so often we prefer to see these connections as a different name for reasons such as length of connection names, better readability, or security. Spotlight 12.4 introduces a new field called ‘Display Name’ in the Connection Properties window. You can customize the display name for SQL Server and Windows Server connections. The customized display name is used in all displays including the Heatmap, connection tree, connection lists, reports, tables, grids/charts, alarms, alarm actions, alarm descriptions, and drilldowns. It’s also available as an Alarm Message Variable.
The New Alarms Report
Would you like to export a listing of all raised alarms from any connection during any period? That is now possible with the new Alarms Report. This report gives you the ability to generate alarms based on multiple connections, alarm names and severities, along with grouping by alarm or connection name. You can find it under the Reports tab as the third reported listed.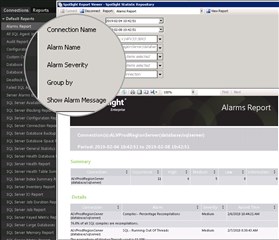
The New ‘SQL – Running Out of Threads’ Alarm
You’ll notice a new alarm named SQL - Running out of Threads raised when the number of worker threads in use is high compared to the maximum number of worker threads configured. In this case, try to reduce number of transactions.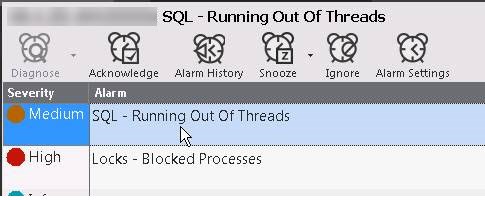
Command-Line Planned Outage Configuration:
In dealing with a high number of connections, at times, configuration maintenance can be more efficient using a command-line rather than the online application. You can now schedule planned outages by utilizing the Windows Powershell through the command line. Review the details of this command here.
The New Alarm Actions Condition Based on a Period:
Configuration of alarm actions has been enhanced to allow for the condition of taking an action (or taking no action) when an alarm is raised between two specific days and times.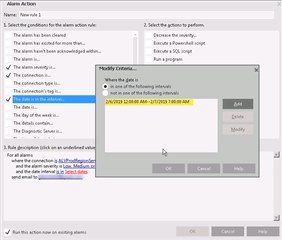
Enhanced Filter Options of the Sessions Drilldown:
The SQL Server SQL Activity / Sessions drilldown has been enhanced to make the “Active Sessions” and “System Sessions” filters more visible and accessible within the drilldown without having to open the settings dialogue window.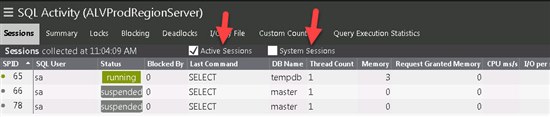
The New In-Memory Data Grid of the Databases Drilldown:
When monitoring SQL Server, the new In-Memory view has been added to the Databases drilldown to show memory consumption of In-Memory OLTP.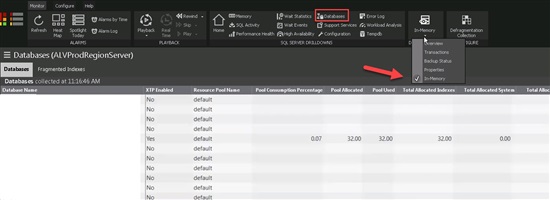
Download the latest version of Spotlight from here.
-

Darren Mallette
over 6 years ago
-
Cancel
-
Up
0
Down
-
-
Reply
-
More
-
Cancel
Comment-

Darren Mallette
over 6 years ago
-
Cancel
-
Up
0
Down
-
-
Reply
-
More
-
Cancel
Children