
Navigating Foglight for Databases
Behind the opening screen of Foglight for Cross-Platform Databases lies a wealth of overview and detail screens to give you a clear picture of database performance issues and their causes. But to really take advantage of what the tool provides, you need to have a sense of how to get around.
In this post, I’ll show the three key ways to navigate. First, we’ll cover just freely browsing the available screens. Second, we’ll see how Foglight’s alarm-driven workflow provides a more guided experience of getting from an email alert about a problem down to seeing the root cause. Lastly, we’ll look at a new Foglight feature called Advisories, which provide even more comprehensive guidance.
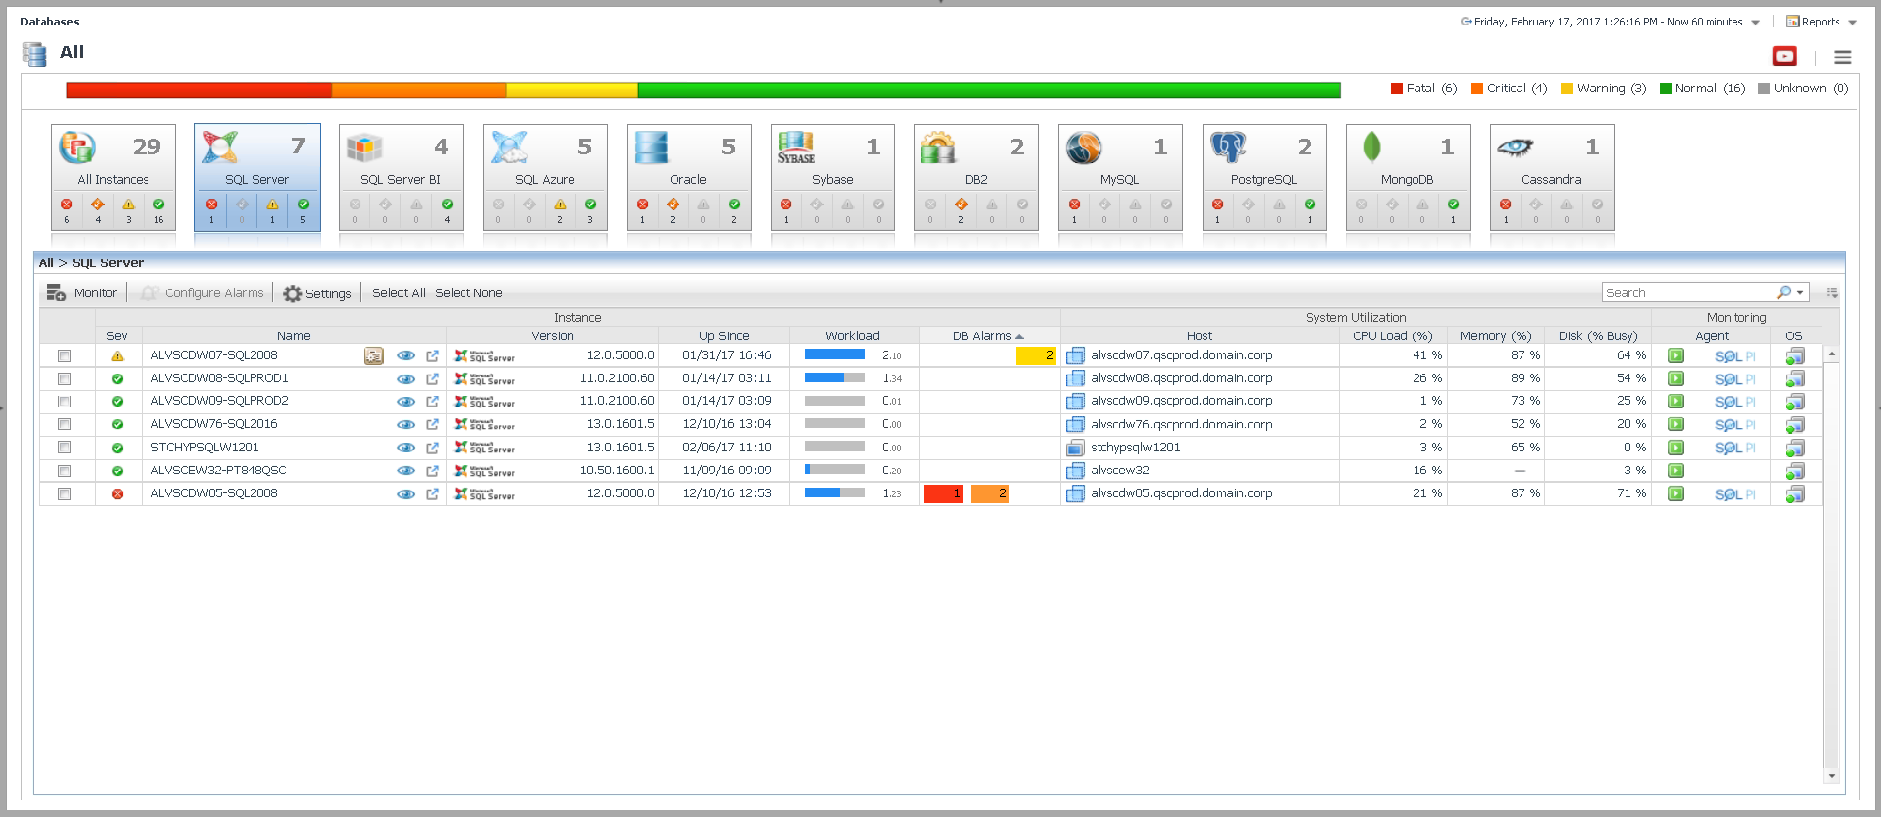
Let’s start with just freely browsing Foglight. From the start page, click on the name of an instance.
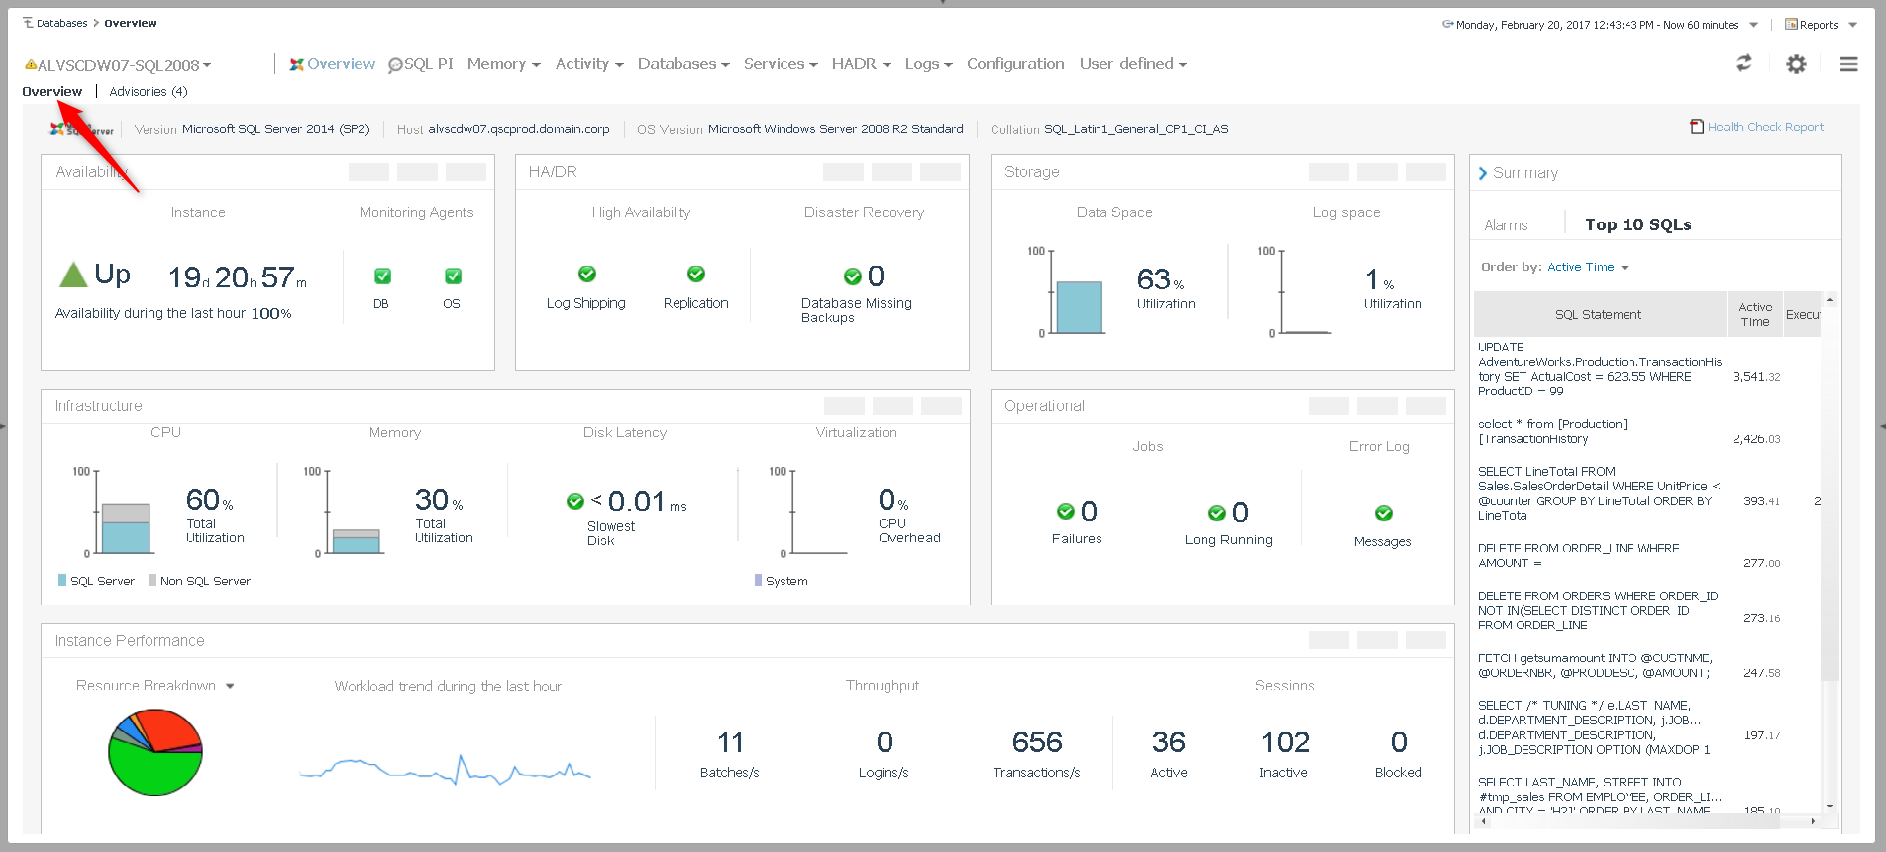
We should now be at the Overview page (click Overview as above if not). The Overview page is your at-a-glance view of all the key performance indicators for a particular instance.
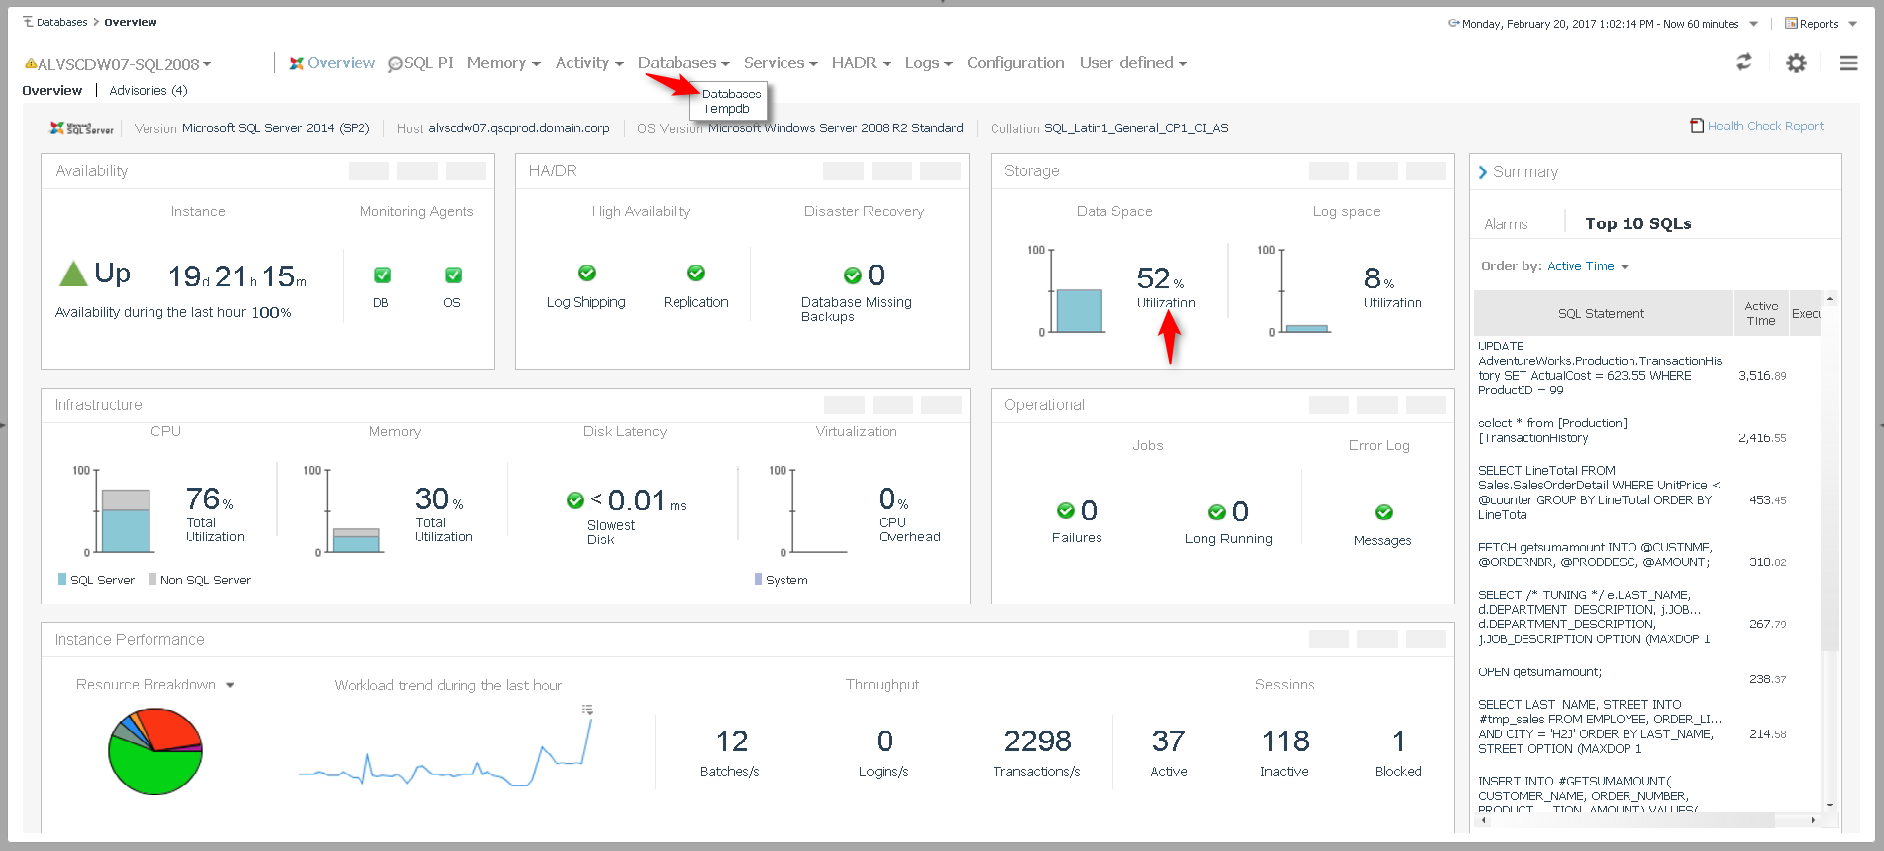
From the Overview screen, there are two ways to delve into the details. You can either choose a drilldown from the navigation links at the top of the screen, or click on the links next to one of the resource graphics.
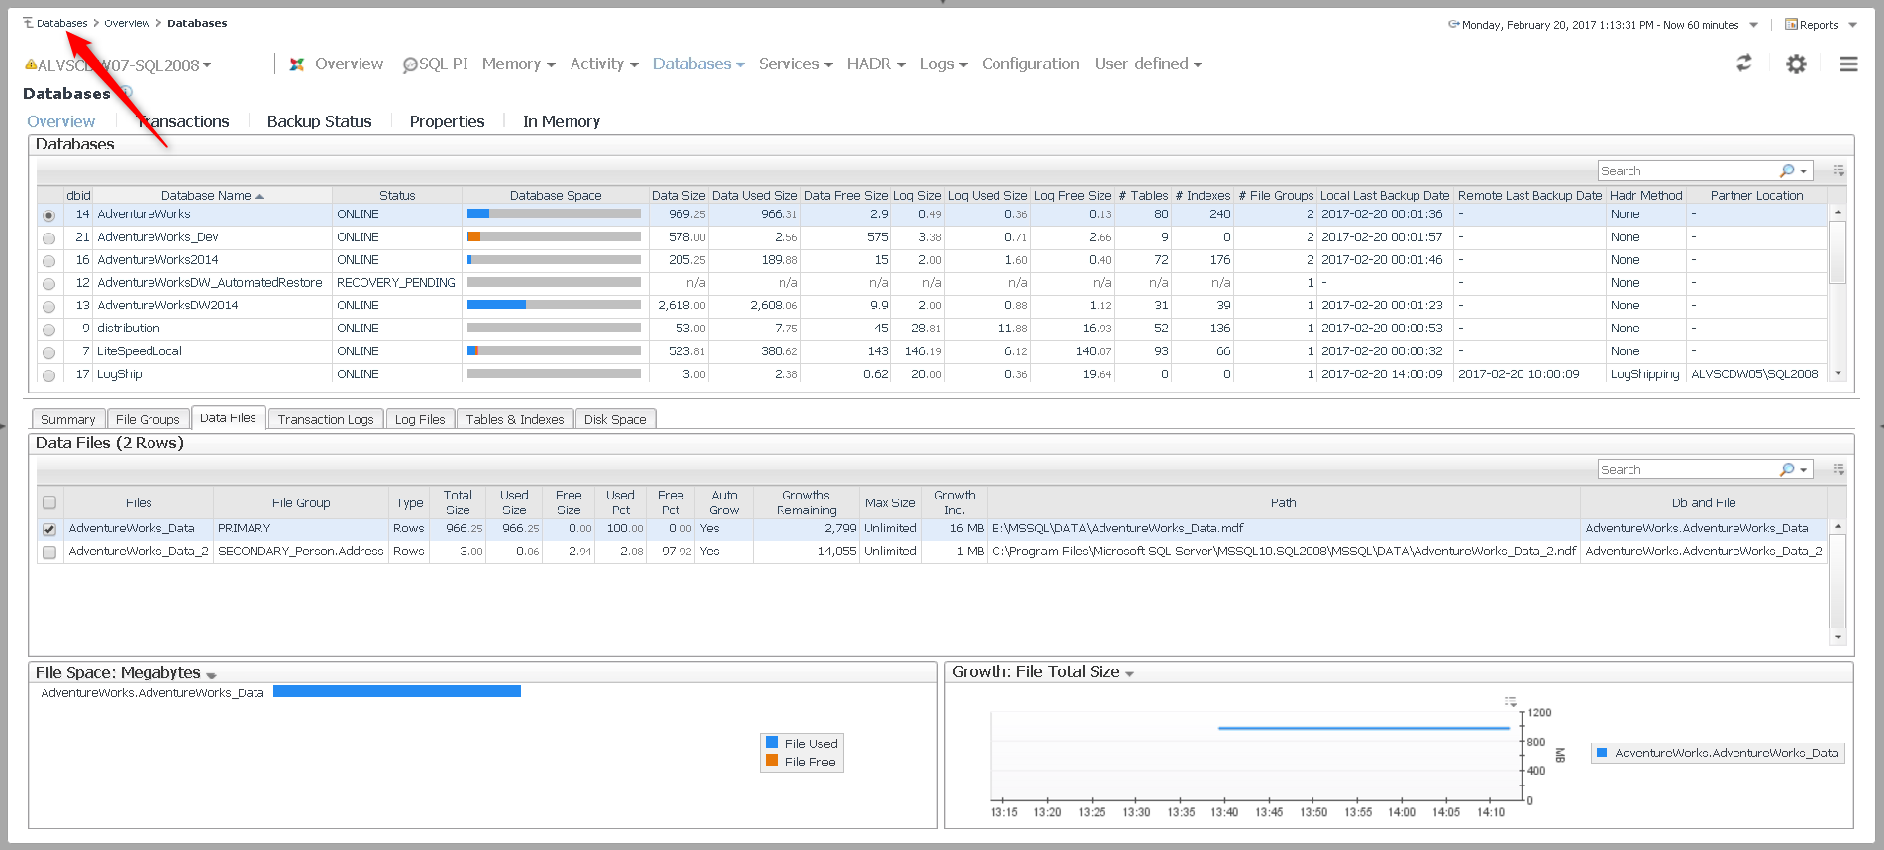
And now we’re down to the detail level. This example covers database status and space consumption, but exploring the detail screens for all of the other metrics follows the exact same workflow. Pretty simple stuff, so let’s get back to our start page by clicking Databases in the bread-crumb trail at the top left of the screen.
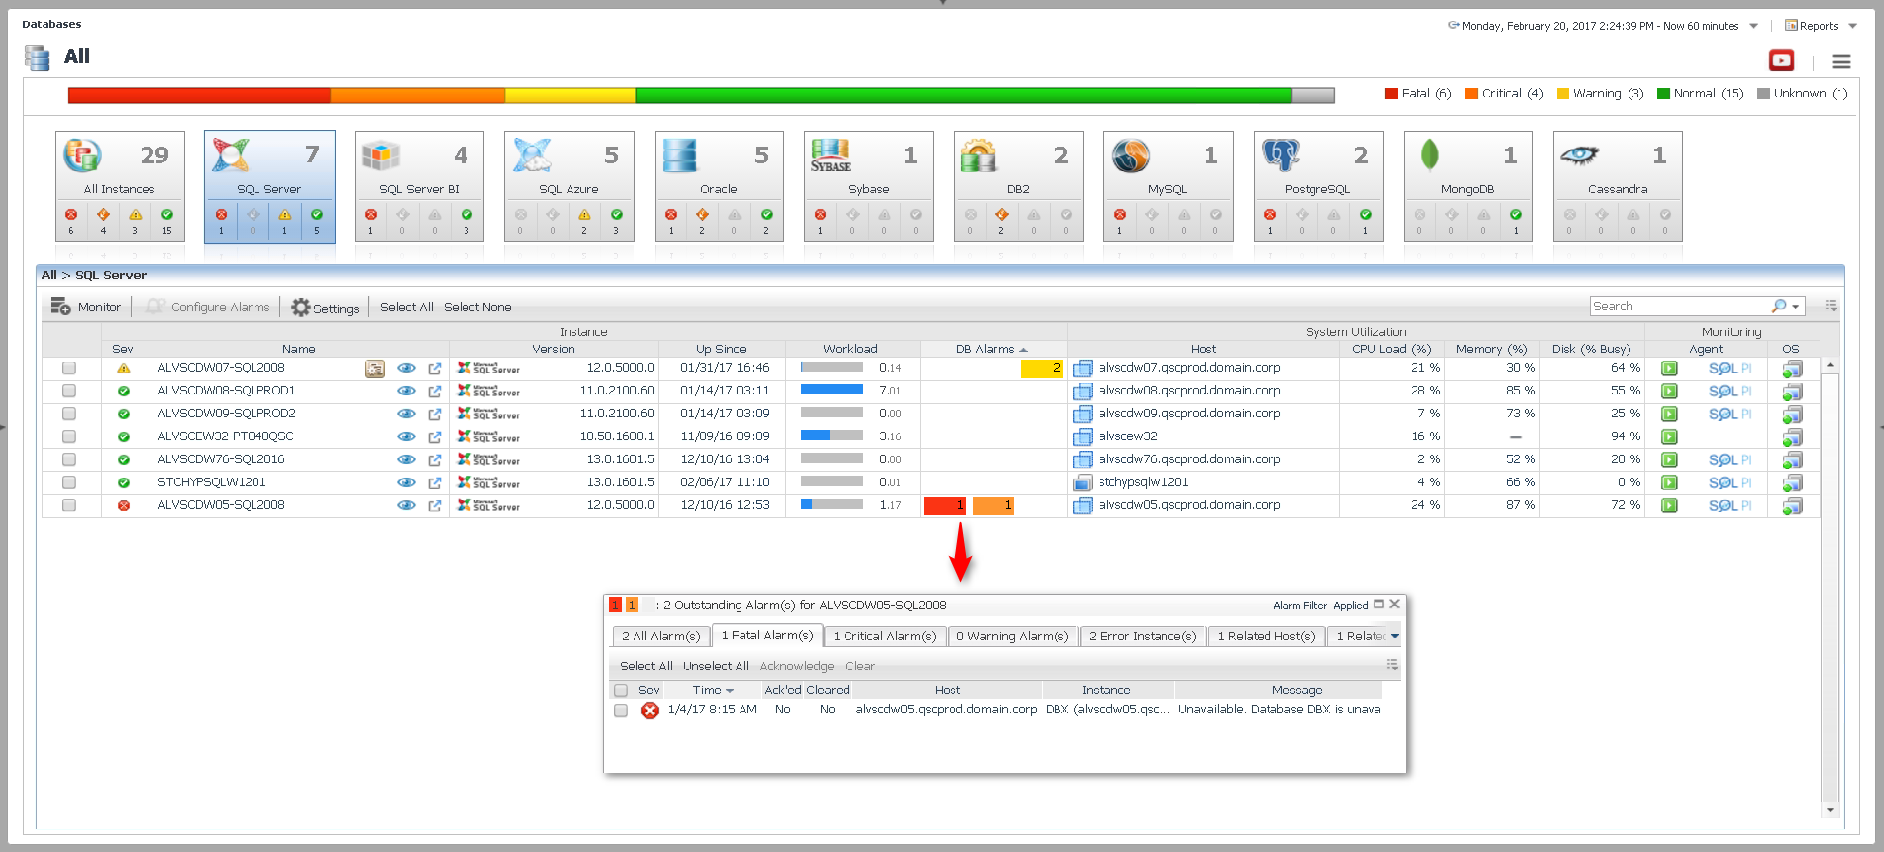
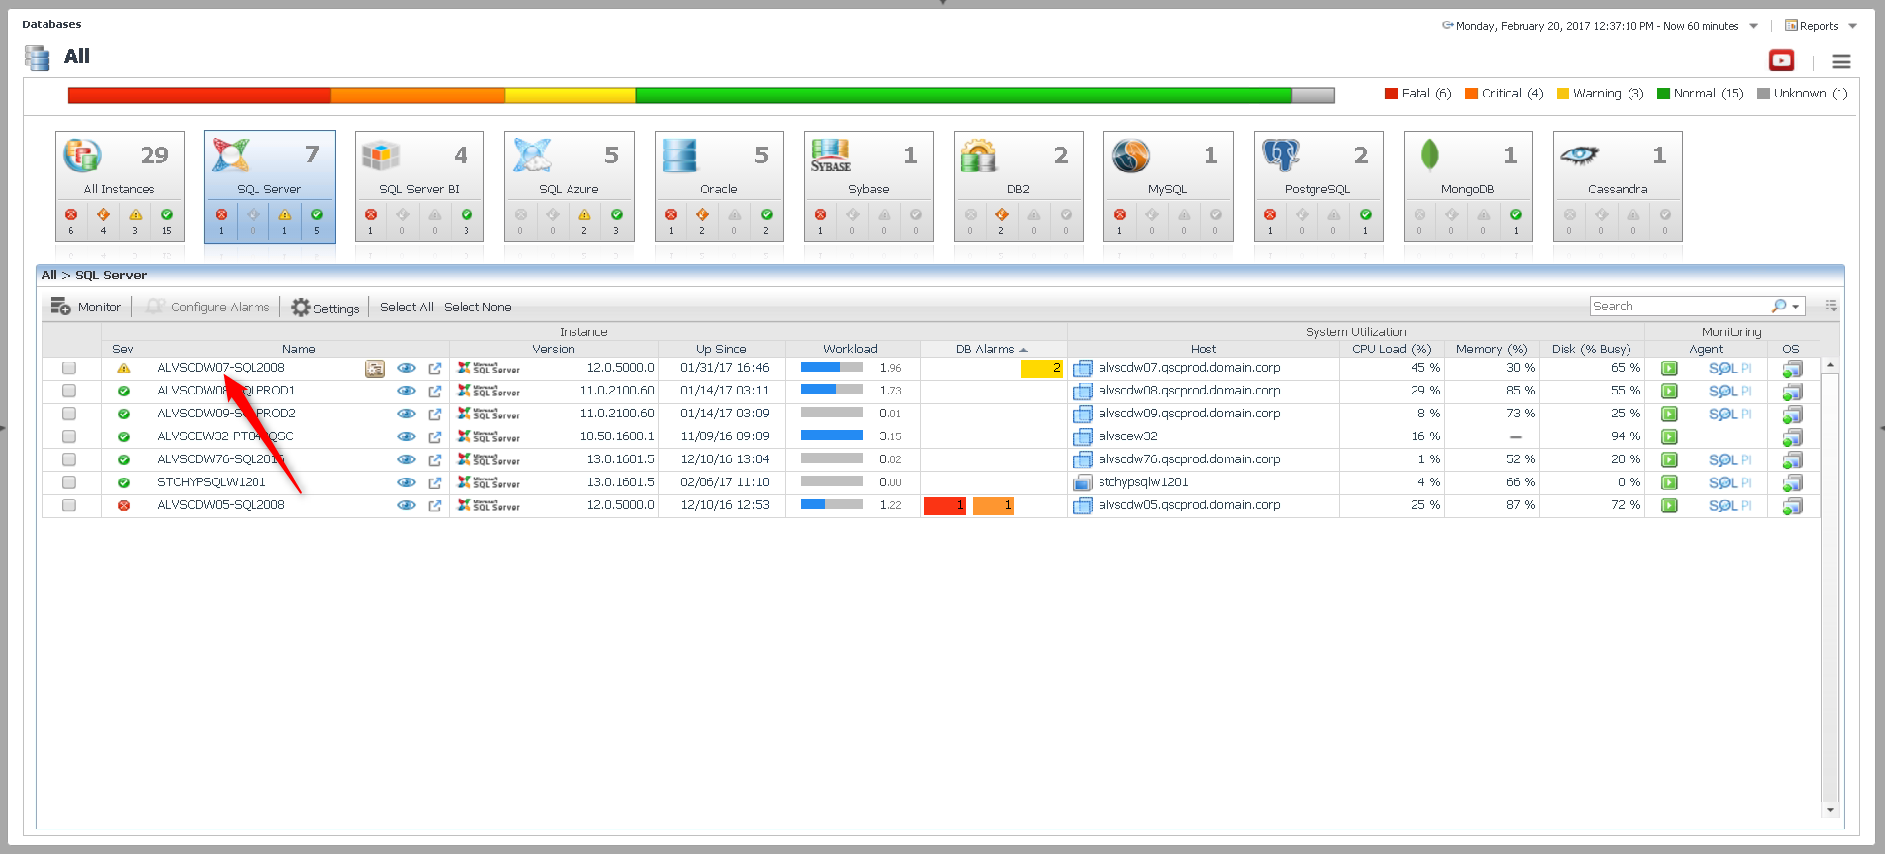
To let Foglight guide you through the issues with its alarm-driven workflow just click on one of the boxes in the DB Alarms column. This will pop up a list of outstanding alarms of the severity level you’ve chosen. Clicking on an item from the list will then take you an alarm detail pop-up.
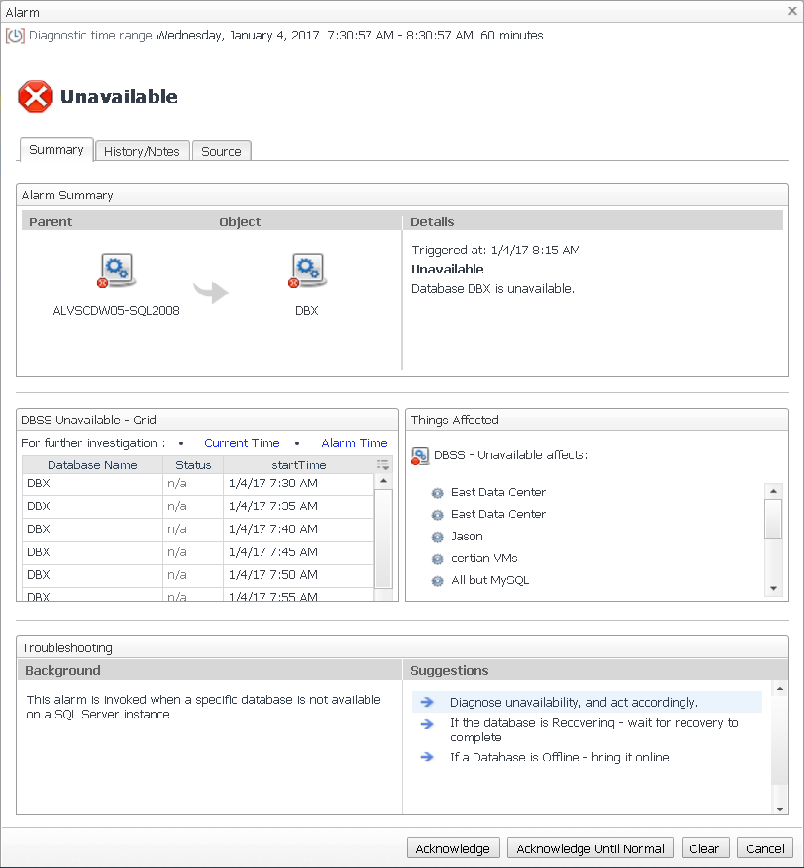
The alarm detail pop-up tells you the where, what and when of the alarm, along with some basic background information and suggestions for dealing with the type of alarm you are seeing. Most importantly though, you can click on the Current Time link (if the alarmed issue is still ongoing) or Alarm Time (for alarmed issues that have occurred earlier and since cleared) to be taken to the appropriate drilldown for the alarmed issue.
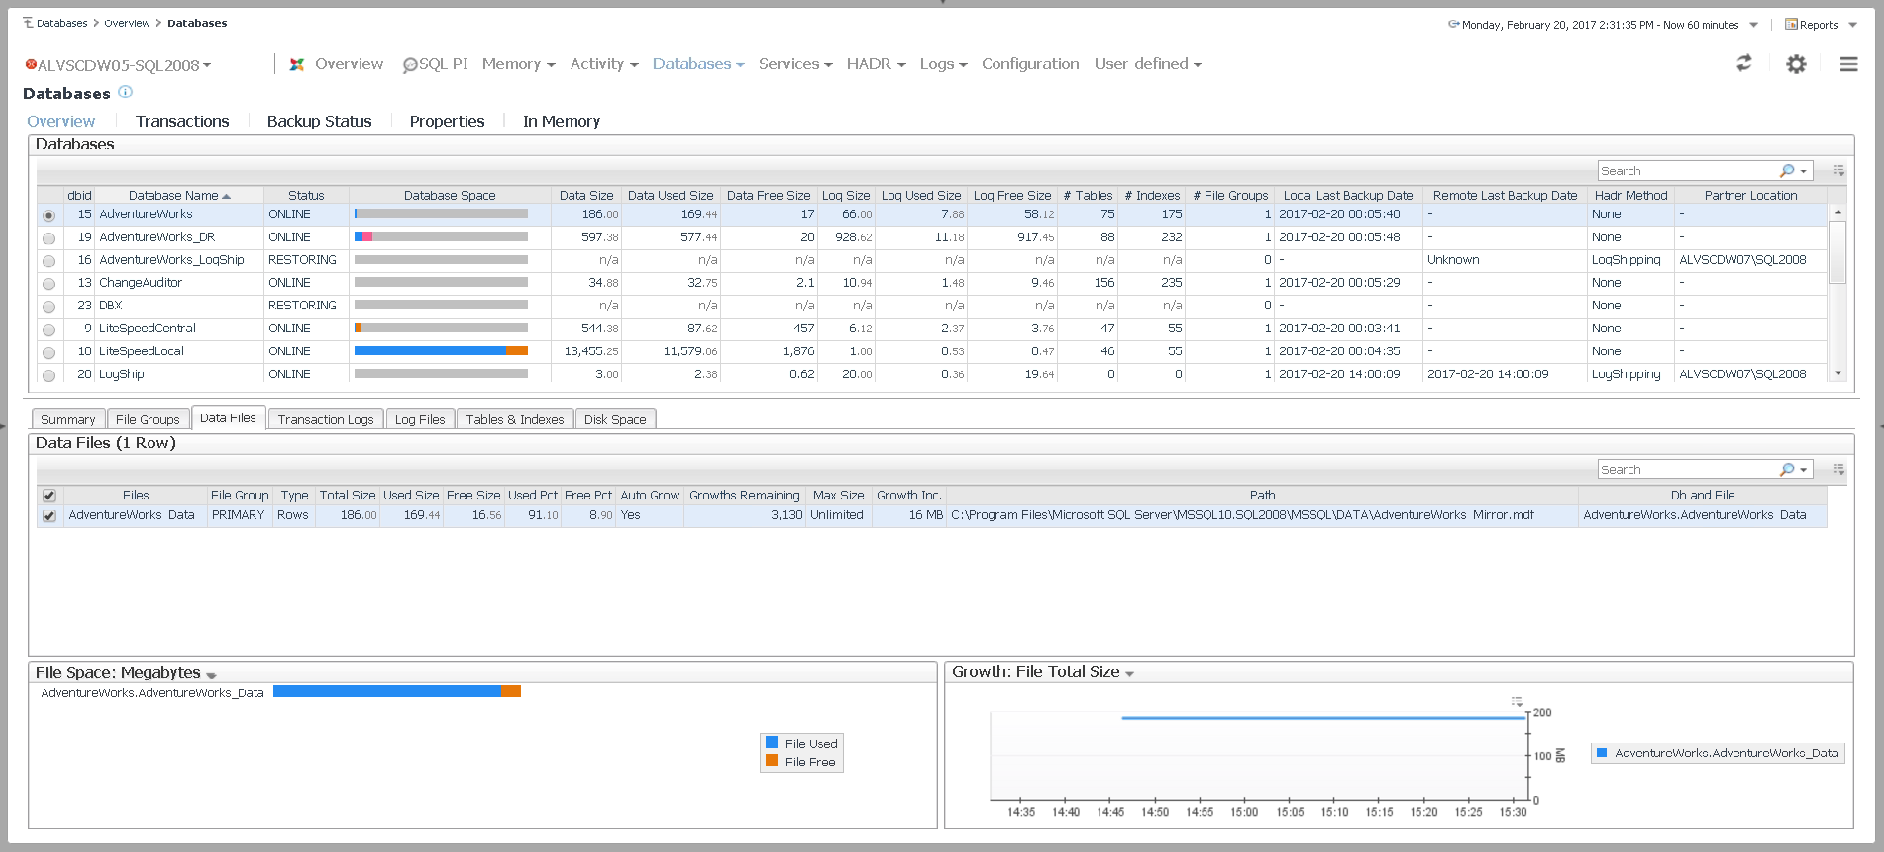
Notice that we’ve at the same drill down that we browsed to earlier, but this time we’ve been guided there by a Foglight alarm. Let’s go back to the Overview page for this instance (via the bread-crumb navigation at top left) and look at the last and most guided type of Foglight navigation that we’ll cover.
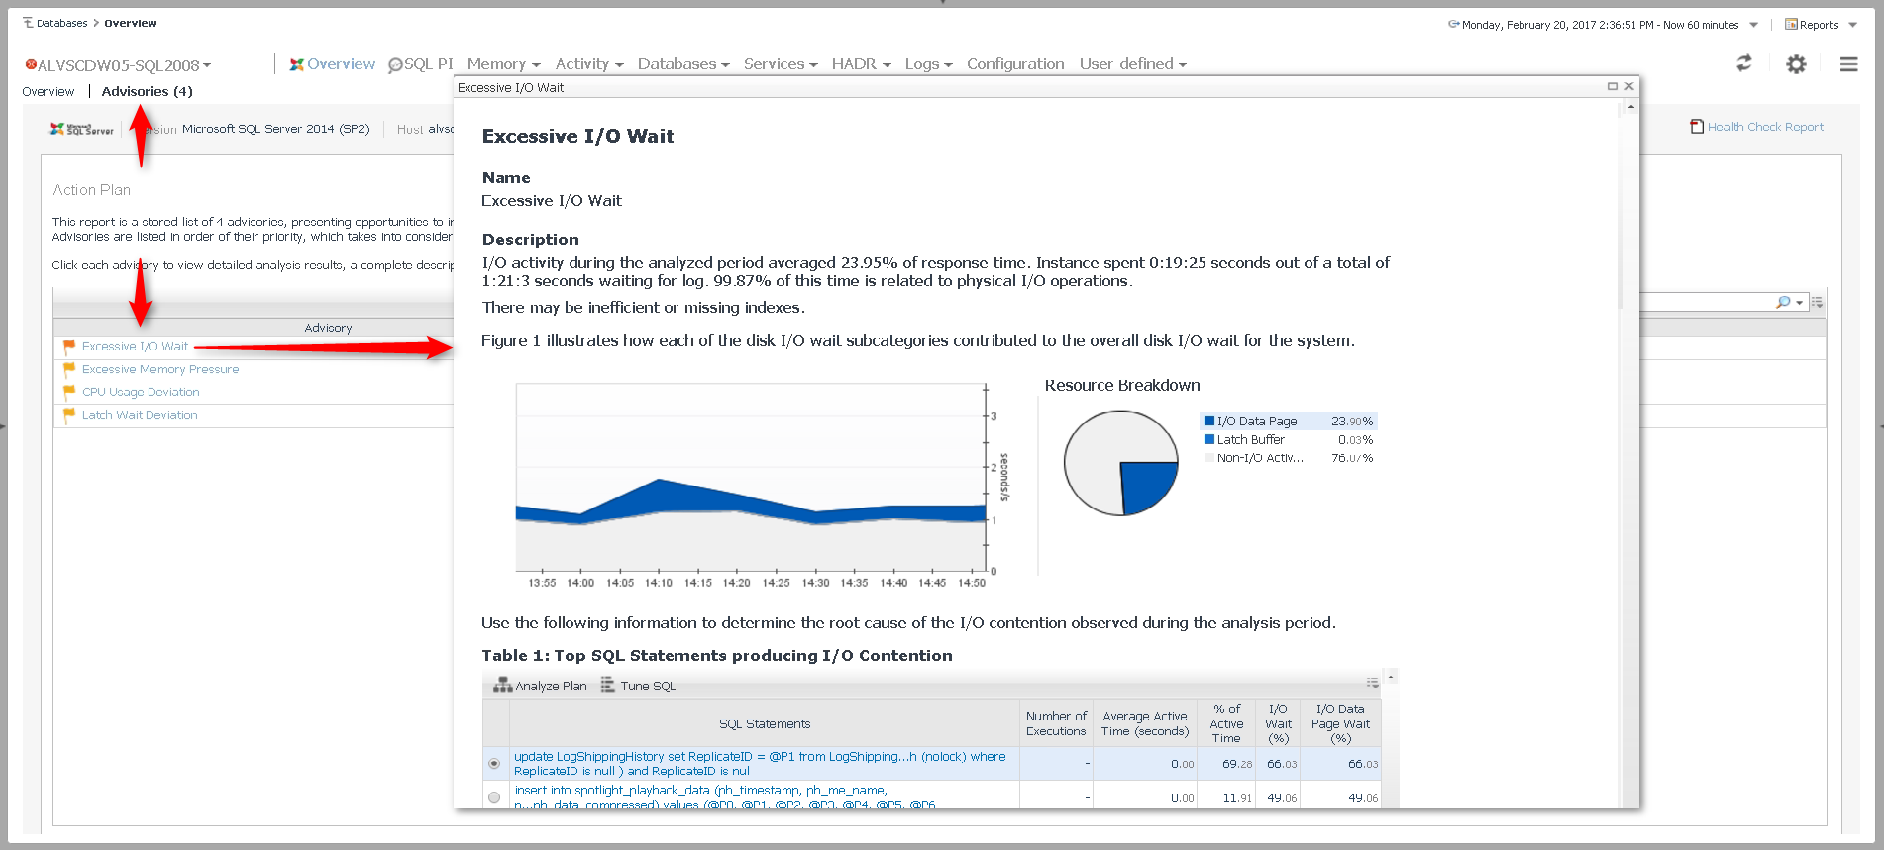
Clicking on the Advisories tab from an Overview page takes you to a new feature of Foglight that provides an even more thoroughly guided workflow through your SQL Server performance issues: Advisories.
An Advisory is a very complete report on a problem – it starts with a plain-english Description of what Foglight has discovered, and then quickly moves to the specific metrics, object and processes involved. Links are available to take you to various drilldowns that will provide details and context on the issue, and recommendations and additional background are also available.
So whether your preferred way of exploring SQL Server issues is by freely browsing around, getting a little or a lot of guidance, or some combination of those, Foglight keeps you sailing through the ocean of db performance metrics!
P.S. This post has covered the real-time performance management aspects of Foglight for Databases. Performance Investigator (PI) contains the other half of Foglight for Databases – an historical and highly detailed analysis of your database server workload, right down to the statement level. It’s such a rich topic that I've addressed it in a separate post available here.
All of my Quest Database Performance blog posts can be found here.
