
In this post, some tips for working with User-Defined Queries (UDC's) were introduced.
We left off with the idea of creating a custom dashboard showing UDC results from multiple instances.
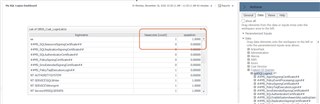
The Foglight data model is organized with a controlling root (typically a host or an agent or an instance). For Databases, the starting point is typically at the instance level. When creating a custom dashboard, I navigate to Databases, then SQL Server, expand my instance, and I can see the "Custom Query Root" collection with my UDC listed underneath (DBSS_Cust_LoginList1). From the UDC post, I named my UDC "LoginList1" so it is easy to see the naming convention.
I want to drag the results onto a table for my dashboard. But I don't see any of the UDC data (loginname, sysadmin, etc) listed. What gives? We really need a way to expose that data - and ideally do it across instances so we don't need to navigate instance by instance to build a dashboard.
We have the ability in Foglight to add in UI components to facilitate what we need to do. I've introduced UI Queries in this post. At first they may seem daunting and overly complex. Don't worry, once you create a few of them, it will be second nature.
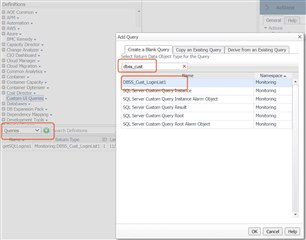
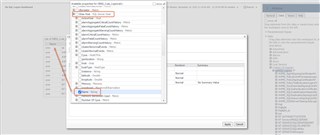
Creating the UI Query for UDC's is actually fairly easy, since we know that Foglight stores our UDC results with a prefix of either "DBSS_Cust", "DBO_Cust" or "DB2_Cust" depending on the DB platform. I just need to search the appropriate prefix to get right to my query data object type:
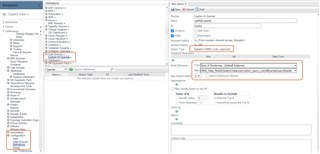
Adding the rest of the query for UDC data is fairly easy - give it a name, check the UI query and public boxes, specify "Monitoring (Default Instance) for the root, then the path you drilldown to is always going to be:
/DBSS_Data_Model/clusters/instances/custom_query_root/allQueries/queryResults
(It may be slightly different for Oracle and DB2). You can test the query along the way to make sure you're getting the correct result set (it should return the "is key" values you defined when the UDC was set up.)
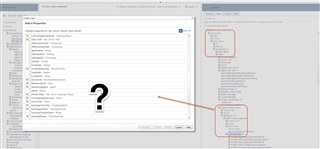
Once you save the UI Query, and return to your custom dashboard, you will see the module (Custom Queries - this was added as a module in the Definitions dashboard) along with the query name available to be dropped on to the dashboard. No need to navigate instance by instance anymore..
The above screenshot also shows the difference between setting the "Frequently Modified" flag when setting up the UDC. The columns "loginname" and "hasaccess" were un-checked, while "sysadmin" was checked. The latter gets stored as a metric with various values you can select. This is why it was "clickable" in the previous post - so you can track the value of sysadmin over time. In this case, it probably should've been unchecked since the use case was to show which logins have sysadmin and other server roles currently.
Anyways... once you've selected your columns, you can show the table in the dashboard. You can further modify the layout and properties if you wish.
But wait, there's more!
What if we had cloned the UDC to other instances? The instance name wasn't in our original UDC query.. so how do we show that in our table? It would certainly be good to know which instance the login belongs to!
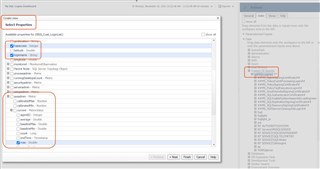
Remember how Foglight stores it's data in models? We have a "DBSS_Instance" model to represent a SQL Server instance. When Foglight stores the UDC data, it attaches to the model. Meta-data from the model is also available to put on the dashboards, so we would simply pick an appropriate value - in this case, DBSS_Host -> name would give us the instance's host name. We could add the agent name or the host-instance pairing as well.
Stay tuned for additional tips on UDC's!
