
I was recently talking to a customer who wanted some help tracking Oracle process memory usage on Windows. They had a problem with a bug causing a memory leak and had a support case open for that. They were happy with the SQL PI feature in Foglight that could show them what SQL was running but also wanted to correlate this with the process usage.
So, for a bit of background, when you start to monitor Oracle (or SQL Server etc) with Foglight you get the option to create an OS agent. We call them hostagents. But what isn’t clear is that the host agent is created with a lot of defaults which can then be customized for more details on OS processes.
So once up and running with my lab monitoring Oracle and Windows, let’s take a look at what the host agent is doing:
Click on the name of the host. Also if you don’t see the system utilization, click on the customizer icon, highlighted just under the word heatmap.
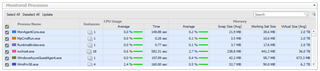
You should get something like this:
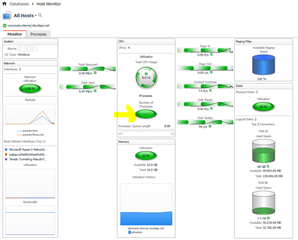
But if we click into items such as cpu or memory we don’t see any process information:
So, let’s look at how we can customize the agent.
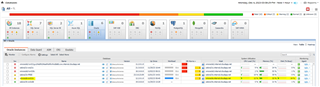
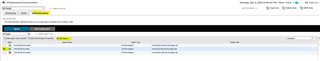
Go to the Infrastructure Dashboard, and click on the Administration Tab:
Select the agent and click Edit Agent
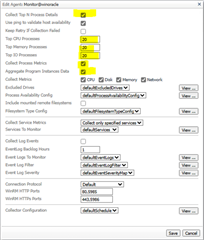
Below I’ve highlighted the items of interest.
Firstly, let’s enable “Collect Top N Process Details” and for the TOP items put in 20, and the Collect Process Metrics. This would normally be the default for an agent.
Click Save
After about 5 mins we should start to see more data. Normally top 10 is the default, so choose a number that allows you to get the detail you need, for example on Windows there are a lot of windows processes which might push down the list your user processes.
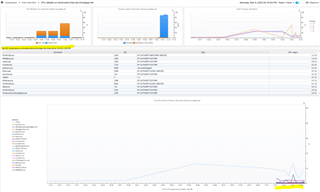
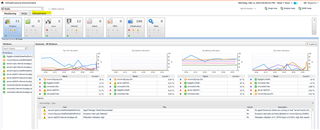
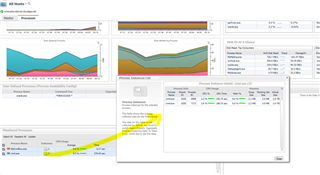
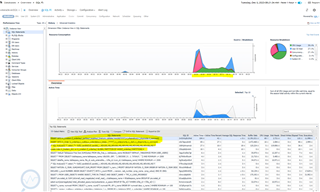
And from the processes tab, we see the top CPU and memory top right as well as disk io metrics
And at the bottom of the dashboard we see the monitored processes, and aggregate metrics.
We can also monitor individual processes and alarm if the expected count is wrong:
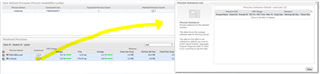
Copy the defaultProcessAvailabilityConfig and then Edit it.
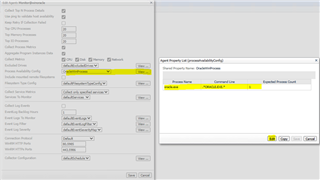
Here we would get an alarm if the expected count of 1 isn’t met.
Useful video here: https://support.quest.com/kb/4299173/how-to-monitor-specific-os-processes-using-the-infrastructure-cartridge-process-availability-rule
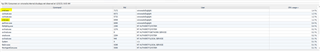
But finally, we might also wish to remove the aggregate feature, although be wary that some systems spawn many duplicate processes which might bring in a lot of data for Foglight if replicated on a lot of systems.
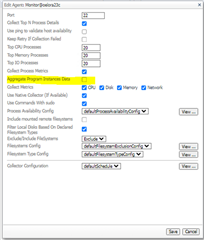
When this option is on, each process with the same name would be grouped and aggregated.
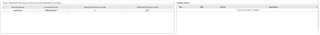
EG, no detail here:
Let’s take this feature off:
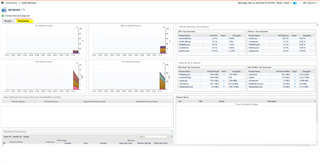
This is most useful in a custom dashboard where we can now locate the specific process and track cpu and memory usage over time:
Summary
In summary these capabilities allow us to correlate OS metrics with the workload taking place at that time. We can product a custom dashboard and track the metrics for the oracle.exe process.
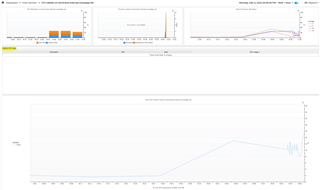
So here were we see an increase in CPU and memory at 09:05
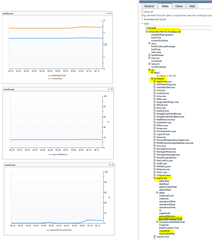
We can see that same workload in SQL PI
Hope you find that useful. The agent is similar for Linux as well.
