

Let’s face it, tuning SQL statements is time-consuming, often frustrating and just plain hard. For many years, I’ve been giving performance tuning presentations, and through those years I’ve managed to whittle it down to five simple manual tuning tips. However lately, I’ve found that you only really need two automated tuning steps to get the job done quickly without burning a ton of brain cells in the process. In this blog, I’ll discuss my five manual tips, along with two automated tips to show you how you can quickly tune poorly performing SQL statements.
Why do SQL statements need tuning?
Before we talk about tuning, let’s look at why we would tune SQL statements in the first place. Why wouldn’t we just throw faster hardware at the problem? Unfortunately, this is a rather expensive solution. Poorly written SQL statements consume mass amounts of CPU and memory and often perform large amounts of I/O. Replacing or upgrading the hardware may temporarily speed up a query, but as data grows and workloads change, that same query will continue to consume all the resources and cost you more in the long run. Tuning the query is a cheaper and more resilient solution.
So, let’s start with my top five manual tuning tips which I’ve discussed before and are listed below.
- Monitor wait time
- Look at wait events/types and record baseline metrics.
- Review the execution plan
- Look for expensive steps and know what’s supporting the plan.
- Gather object information
- Use this method to gain further insight into expensive tables and/or indexes and focus on tuning them.
- Find the driving table
- Consider SQL diagramming techniques.
- Engineer out the stupid
- This is usually where I find myself.
Applying manual tuning best practices
Monitoring wait time will tell you which SQL statements are spending the most time in the database; they are also usually consuming most of the resources. Focusing on these statements will not only improve their performance, but will free up computing power for other statements. Most relational database types collect wait events/types and wait times so you can quickly see what queries are waiting on, plus each wait event gives great clues on how to tune.
Once you find the SQL statements to focus on, the next step is to review the execution plan, look for the most expensive steps and try to reduce their cost. You will need to gather more information about the objects that each expensive step is working on. This will give you some idea of how to tune it. Often, adding or changing the type of index used can help. Also, review the first step of the execution plan to make sure that the table in this step is the best one to start with (if there are multiple tables in the query). Having less data returned at the beginning of the execution plan is better than reading all the data and then filtering out the unwanted data at the end. This is a waste of valuable resources.
Finally, review the SQL statement for any mistakes that were made while writing the query. For example, look for implicit conversions, joining of several views instead of underlying tables, no WHERE clause or the use of ‘SELECT *’. Often, we are marching to a deadline when creating queries and these mistakes can easily creep in without anyone noticing.
If you follow these five manual tips, they will take you a long way. However, they can be very time consuming.
Shifting to an automated method
To save time, you may want to consider automating your tuning efforts using a database monitoring tool. For the below example, I utilize the database performance monitoring tool, Foglight for Databases to automate the tuning process. My two-step automated tuning tips are as follows.
- Monitor wait time
- Advanced tools such as Foglight can quickly show which SQL statements to focus on first.
- Tune the query with SQL Optimizer (which is a small add-on to Foglight)
- You can perform a query rewrite.
- Or optimize the indexes.
The following case study shows you how quickly these two automated tips can tune a poorly performing query. The stored procedure (listed below) returns popular flights by city and day of week. The dataset comes from the Department of Transportation, where you can download every month of every year of flights within the U.S.
CREATE PROCEDURE get_city_day_flights
@beg_date DATETIME, @end_date DATETIME, @city VARCHAR(50), @day_of_week VARCHAR(10)
AS
SELECT
o.carrier, uc.description AS carrier_name, o.fl_date,o.fl_num,o.tail_num
,ao.description AS origin_airport,co.Description AS origin_city
,ad.description AS destination_airport
,cd.Description AS destination_city ,w.Description Day_of_Wed
FROM t_ontime_2015 o
        INNER JOIN L_UNIQUE_CARRIERS AS uc ON uc.Code = o.UNIQUE_CARRIER
        INNER JOIN L_AIRPORT_ID AS ao ON ao.Code = o.ORIGIN_AIRPORT_ID
        INNER JOIN L_AIRPORT_ID AS ad ON ad.Code = o.DEST_AIRPORT_ID
        INNER JOIN L_CITY_MARKET_ID AS co ON co.Code = o.ORIGIN_CITY_MARKET_ID
        INNER JOIN L_CITY_MARKET_ID AS cd ON cd.Code = o.DEST_CITY_MARKET_ID
        INNER JOIN L_WEEKDAYS AS w ON w.Code = o.DAY_OF_WEEK
WHERE fl_date BETWEEN @beg_date AND @end_date
AND co.Description = @city
AND w.Description = @day_of_week
This query was spending the most time in the database and was found to be the top SQL statement in Foglight within a few clicks.
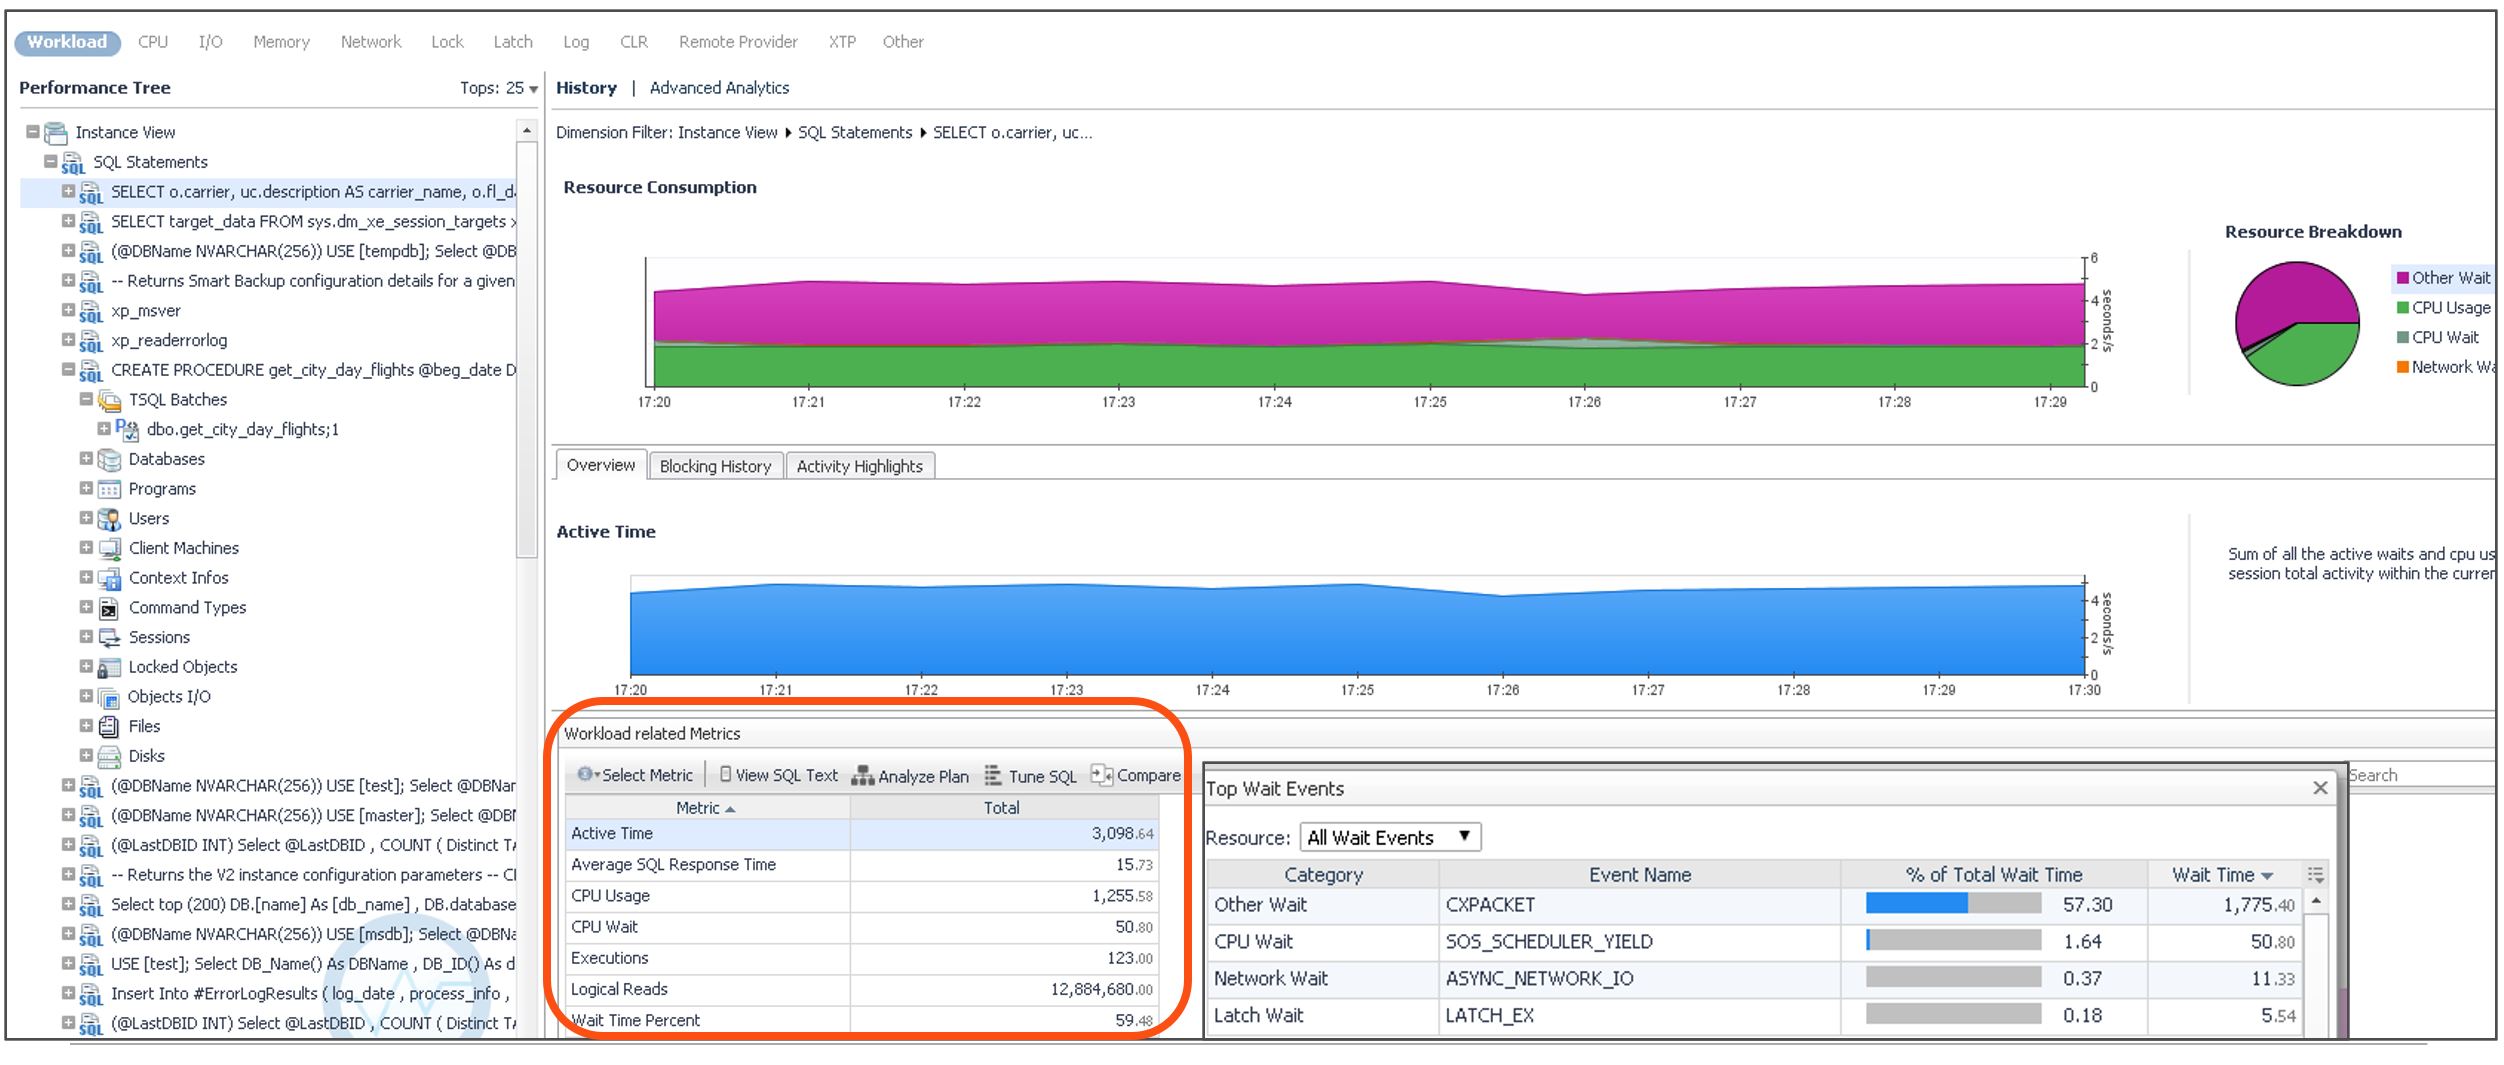 From Foglight, we see that this query spent most of its time on the CXPACKET wait type, with an average execution time of 16 seconds, and it had almost 13 million Logical Reads with only 123 executions. In Foglight, you can tune the SQL statement which will prepare the statement for the SQL Optimizer. The SQL Optimizer then rewrites the query to get the best execution plan.
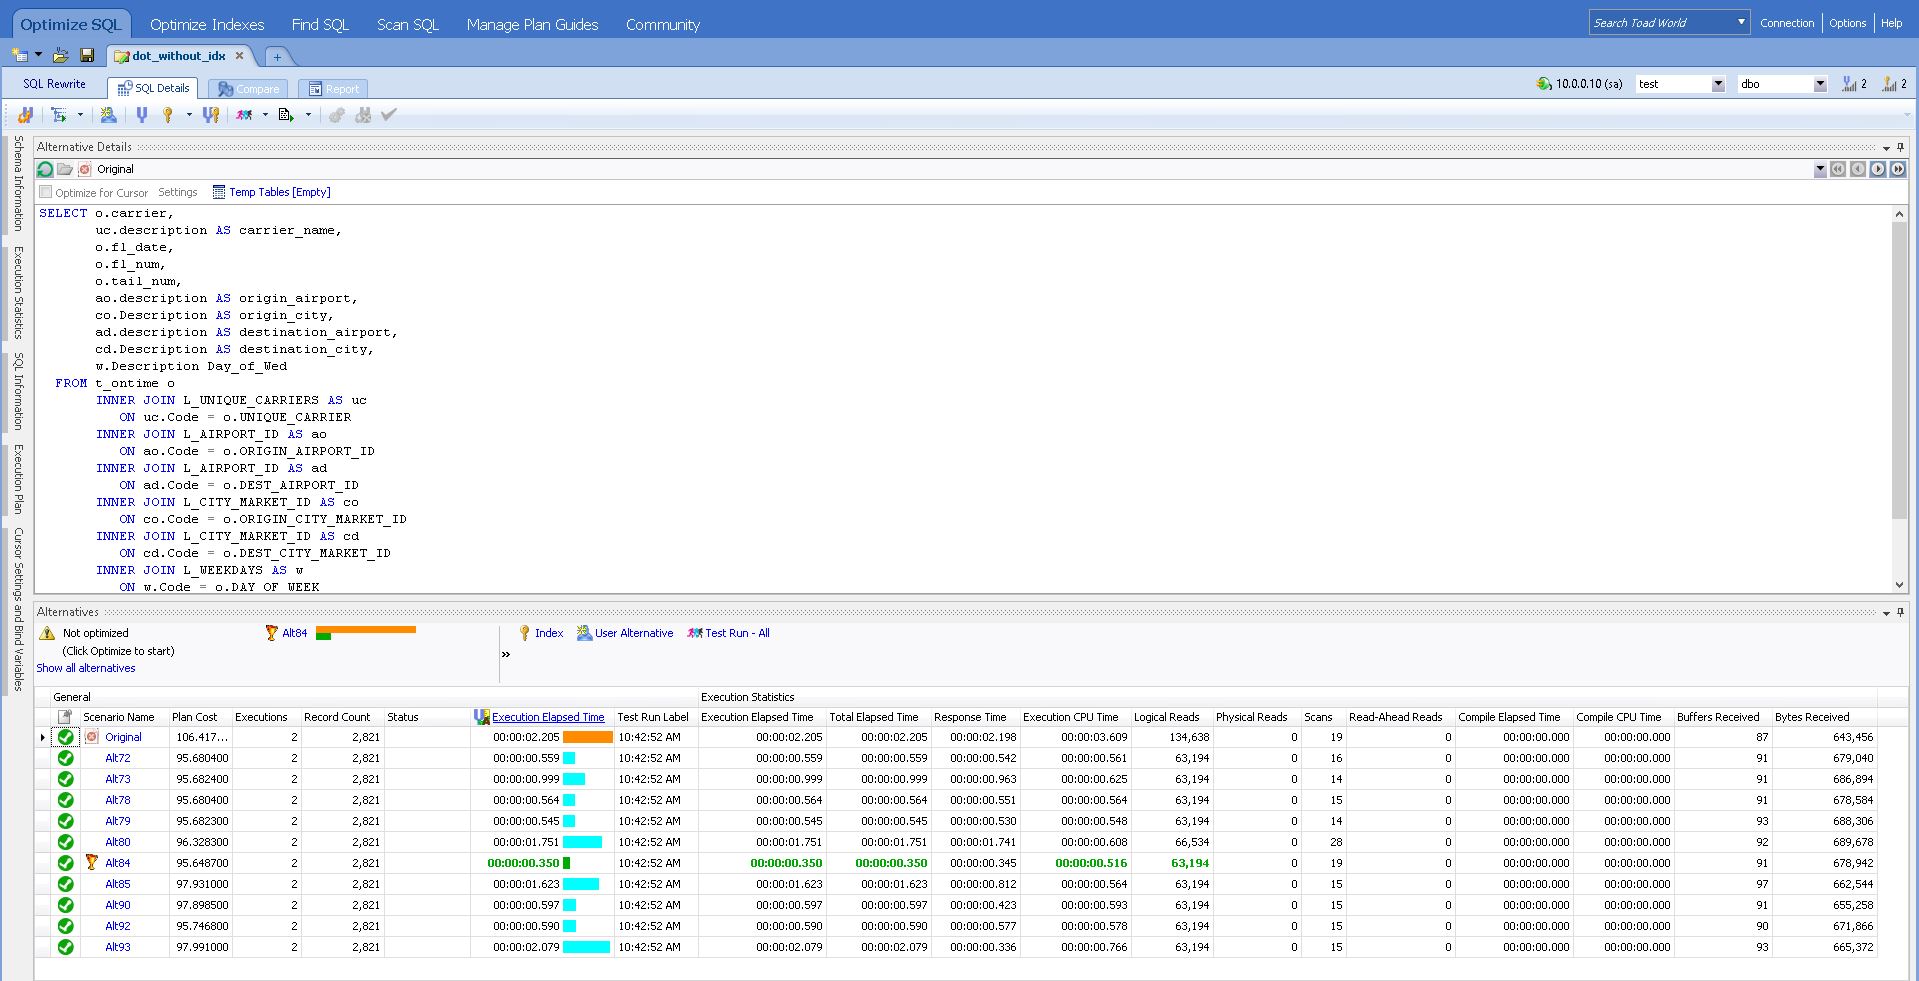
The rewrite had the original query running 2.205 seconds on average and the most optimal execution plan ran in .350 seconds. Over 6 times improvement was made with very little involvement from a database professional.
SQL Optimizer also has the ability to optimize indexes by creating, then testing several candidate indexes, and then running the query several times until it finds the best execution plan.
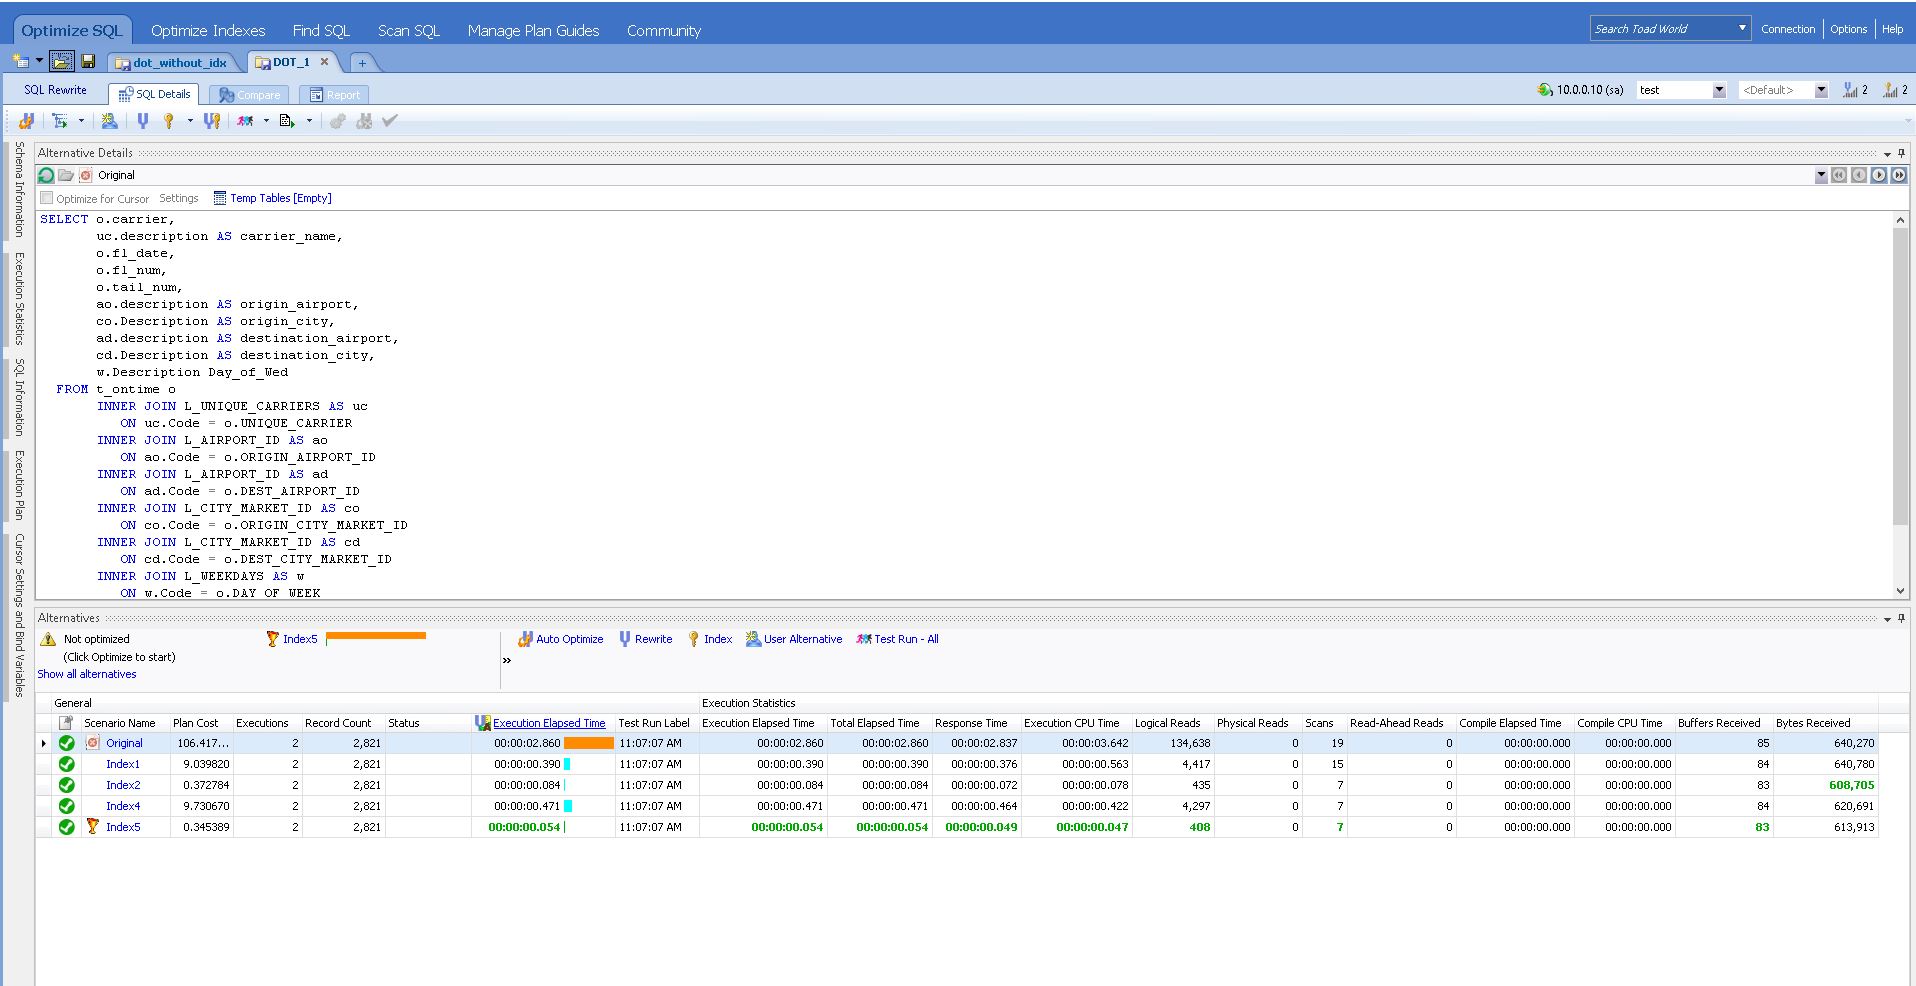
During the index optimization, the original query ran 2.860 seconds on average. The most optimal index had the query running at .054 seconds. This improved by 53 times, again with little involvement needed.
Automating for the future
In summary, using an automated method such as demonstrated here with Foglight and SQL Optimizer allows you to quickly find and tune poorly performing queries which saves time, speeds up performance, and reduces overall resource cost.
If you’re interested in trying a more automated approach to SQL tuning, you can sign up here for a free 30-day trial of Foglight.
