
Hold on, grammar and spelling enthusiasts. Already, you might be thinking, did he mean ‘Complementary’ or ‘Complimentary’? The answer? YES. This blog series focuses on additional Oracle monitoring capabilities beyond monitoring the Oracle instance…’complementary’. But also, Foglight is licensed and priced by the number of Oracle instances you’d like to monitor. Therefore, as long as you have registered the instances that these technologies sit on, they are ‘complimentary’, as in no additional cost to you. Now that we have that cleared up…what will specifically be discussed is each of the ‘tabs’ that can be found on the Database Home page in Foglight for Oracle.
*(Click on the images to enlarge)
In this Part 1 of the blog, Foglight monitoring for Oracle’s Data Guard is reviewed.
What is Oracle Data Guard?
Likely the most common High Availability and Disaster Recovery solution for Oracle environments, Oracle Data Guard is an extension to Oracle and available only in the Oracle Enterprise edition. Oracle Data Guard is a set of services that create and manage standby databases. These standby databases are copies of production databases used in the event of outages. Oracle Data Guard can switch from an unavailable database and apply the production role to the available standby database to limit downtime.
Monitor Data Guard with Foglight
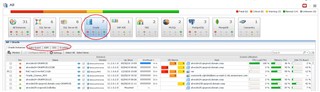
When monitoring any Oracle Primary Database instance that is part of a Data Guard configuration, you’ll see the following metrics populated on the Overview dashboard.
Applied Gap – (Number of) log sequence applied gap between the primary and secondary instances.
Received Gap – (Number of) log sequence received gap between the primary and secondary instances.
So, for example, perhaps there is a network issue between the primary and standby. Oracle will continue to generate archive redo logs on the primary but because of the issue, those logs cannot be shipped to the standby. The Applied/Received Gap metrics will increase and fire an alarm. This will help you identify that there is a problem and allow you to address it before it persists and worsens.
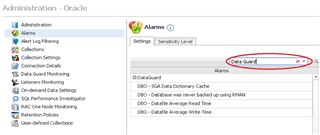
More specifically, here are the Foglight alarms available (when connected to a Data Guard configuration):
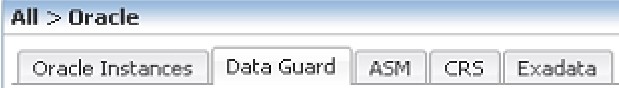
More recently, some Data Guard monitoring enhancements were added to Foglight and “put on its tab.”
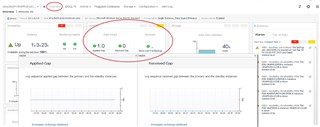
A more comprehensive set of dashboards is available from the Data Guard tab on the Foglight Database Home page for those Oracle administrators that need more detailed information about the current and historical received and applied gap in seconds.
Note: Foglight requires an additional “agent” (connection) to gather the metrics from both the primary and standby database. Foglight will need a 'SYSDBA' connection to the primary and standby (by design in Oracle). More information can be found here: https://docs.oracle.com/cd/B19306_01/server.102/b14237/dynviews_1080.htm#REFRN30413
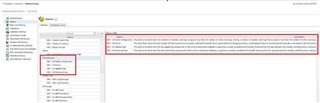
By selecting the + icon to the left of the instance, you can see the entire Data Guard topology including the Primary and the Physical Standby (as shown here). If your environment contains several Data Guard configurations, they can all be displayed here.
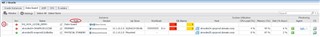
These associated drill-downs are designed to help administrators view and understand the overall health of all Data Guard environments. To navigate, click on the (Data Guard) role to access.
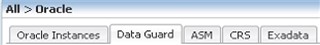
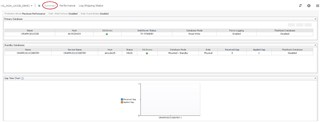
Now, note the three tabs across the top – Summary, Performance, and Log Shipping Status.
In the Summary dashboard, users can better understand several key configuration settings. At top left, Protection Mode, Fast Start Failover status, and Data Guard Broker status are displayed.
Below that, additional configuration information is presented including the database mode, the role, and any received or applied gaps. There is also a Gap Time chart at the bottom.
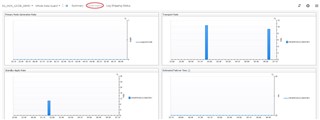
Selecting the Performance tab brings you to a drill-down with information about the rate which the redo is generated for the primary, the transport between the primary and the secondary including its rate (KB/s), the standby apply rate (how fast the standby applies the redo it gets from the primary), and an estimated failover time (in seconds).
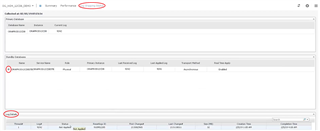
The Log Shipping Status drill-down will display the archive log files. Simply select the radio button to the left of the database name to populate the log details at the bottom.
In Databases>Administration>Alarms, in addition to the Data Guard alarms listed when searching with “DG”, there are alarms listed when searching with “Data Guard”.
For more information, or to request a trial, visit the product page: Foglight database monitoring or Foglight for Oracle

