When monitoring databases for performance, we certainly want to understand things like CPU spikes, memory pressure, I/O latency, and the like. If we see this type of performance, the next step is to take a closer look and attempt to find out what's causing it, right? But taking a step back for a moment, have you ever realized one of the first questions you are often asking yourself when you notice performance deviations is... Is this normal activity (and equally important) for the timeframe I am looking at?
For example, perhaps you notice CPU spikes to 85%. That information in itself is useful information. However, understanding that it is normally around 85% during that time...or conversely, knowing that CPU is normally around 30% in that timeframe will likely change your sense of urgency to address it. This is how Foglight's baseline engine can help. Named Intelliprofile, this patented technology "learns" normal activity over time. An algorithm runs, analyzes the metric activity and establishes the normal behavior for that metric. It aggregates the data to understand the minimum and maximum thresholds. Additionally, this is calculated in context with four time sensitivities - time of day, day of the week, day of the month and week of the month.
In other words, if metric activity is read as higher than the expected activity on a regular basis, IntelliProfile detects this pattern and adjusts the baseline accordingly. On the other hand, if that increased activity occurs only once and for a short period of time, IntelliProfile will filter it as "noise" so as not to scew the baseline data. IntelliProfile will ignore this exception using a noise filtering algorithm. Furthermore, the baseline data used is the most recently collected data, continuously re-learning so as not to use "stale" data.
Baseline data helps us better understand performance trends like that a particular instance is busy on weekday mornings or very active at the end of the month perhaps because of those month-end reports being executed. Foglight's Intelliprofile allows us to quickly understand new instance performance trends or assist an end user tasked with monitoring instances they are unfamiliar with while a colleague is out.
(Click on image to enlarge)
The shaded region represents what has been calculated as the normal baseline range.
The blue line represents actual activity during that time period.
In this example, at approximately 7:08, activity spiked beyond its normal range.
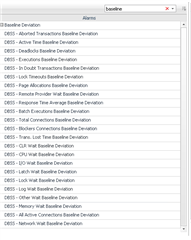
This Foglight baseline capability is further enhanced with a set of Baseline Deviation alarms that can be leveraged to make you aware of when the monitored activity is outside of its normal range.
Understanding normal activity provides a basis for comparison and helps us decide if further investigation is warranted.
Foglight's Intelliprofile does just that.
Yep, you're normal....at least for now.
Visit the Foglight for Databases page for a free trial.


