This discussion has been locked.
You can no longer post new replies to this discussion. If you have a question you can start a new discussion

SQL-PI Statement vs. Batch Executions

Hi all,

I'll start off by mentioning I use Foglight in more of a performance troubleshooting and optimization capacity than for straight administration. We've been trying to get a handle on some of the worst queries in our system, but I'm having trouble interpreting some of the metrics since they're not matching what I'd expect to see in the execution plans.

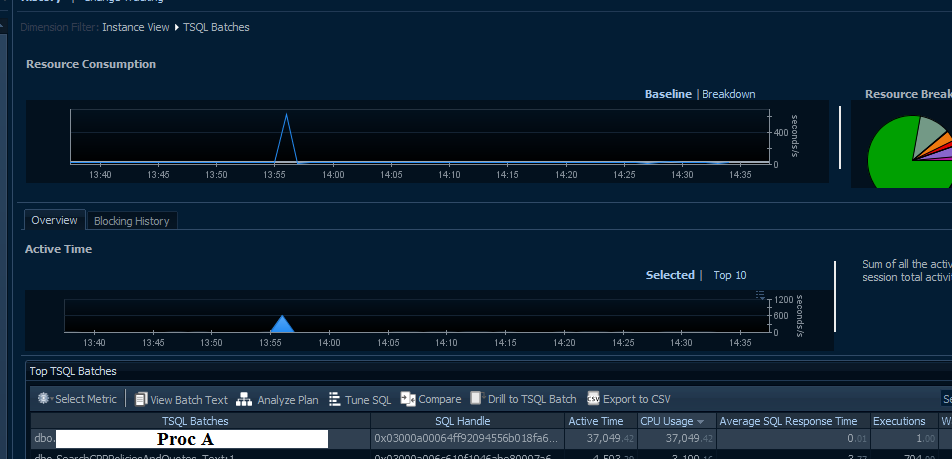
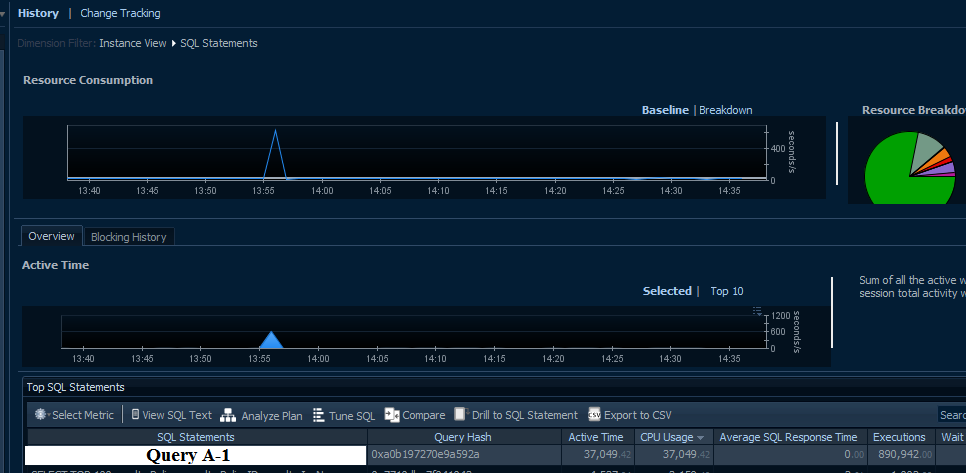
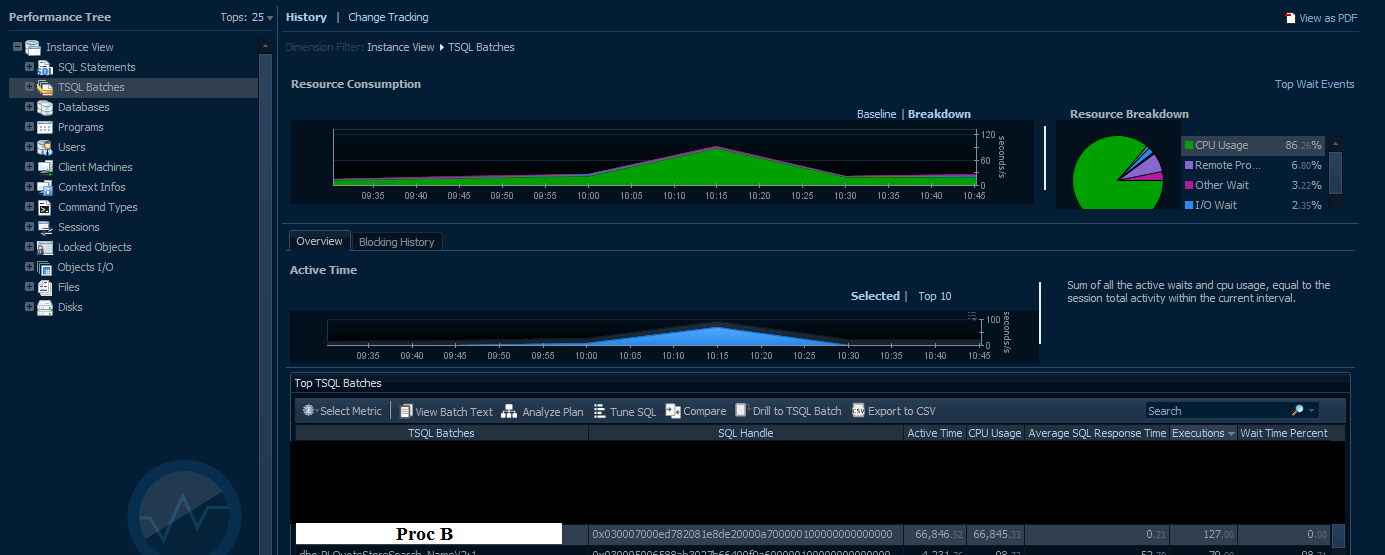
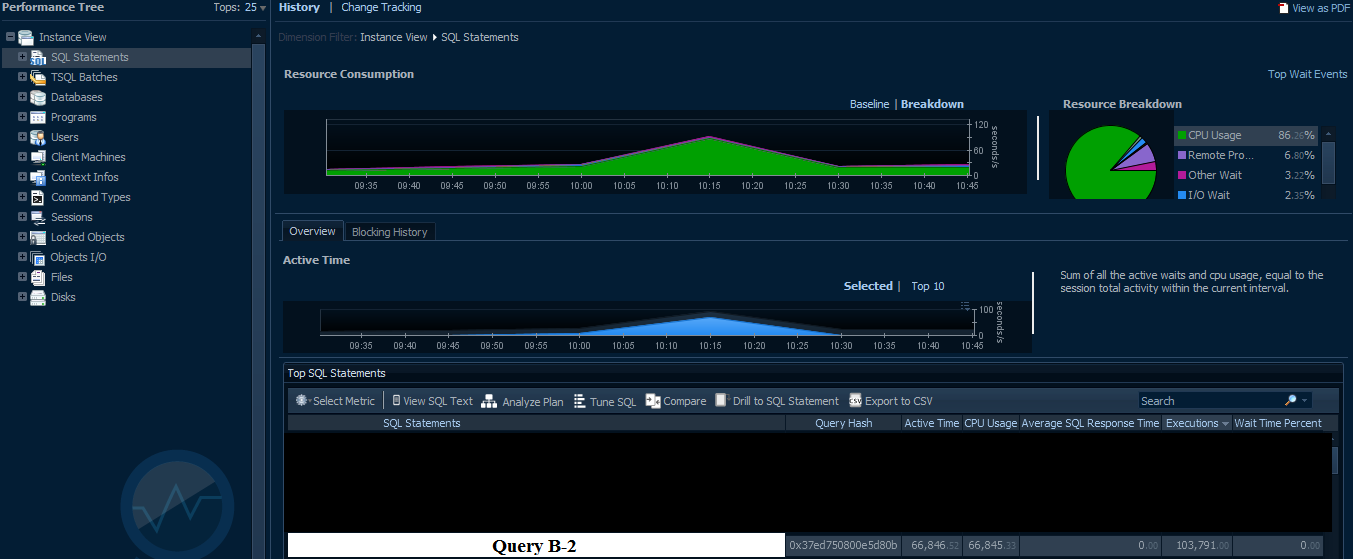
We've seen this happening with a few separate queries across different servers and days. A (non-ad-hoc) sub-query or partial text from a stored proc shows up in the SQL Statements tree view as well as the actual, underlying proc in the TSQL Batches tree, which I take to be just procs and jobs. Another piece of the puzzle is the other portions of that proc don't seem to show up in the Statements side. From the Statements view, we see vastly greater numbers of executions than in the batches tab. These aren't using cursors or loops, so it's not some kind of iteration from there.

What might be causing the discrepancy here? A couple possible explanations:

  • Steps through the execution plans
  • Logical reads from the table
  • Scans (though looking at the exe plans, I'm not convinced about this one)
  • Executions straight from within SSMS vs. callout executions from our website APIs

A few examples:

Batch Exes: 1

Statement Exes: 890,942

Note: I actually have seen this proc a few other times and when it's twice within the window, the Statement exes are almost (but not exactly) twice the executions of the first recorded instance of the Statement exes.


Batch Exes: 127

Statement Exes: 103,791


While this is just two examples, I've seen these and other procs do the same thing over the past couple weeks on different servers. We're running 2008R2 and Foglight 5.7.5. Any insight would be appreciated, thanks in advance!

  • Hi Drew,

    Thanks for your feedback.
    You are correct that Foglight report stored procedures as TSQL Batch. However, a Batch is any group of statements run together and identified by a single sql_handle. Foglight will reports those as Batch as well.
    A single SQL statement is identified by a query_hash and can be executed by multiple Batches.
    This is another reason why the number of executions for a single statement can be different than number of executions of the batch.
    You also mentioned some of the other reasons this may happen.
    In general, the number of executions displayed in Foglight should roughly match the number reported by SQL Server on sys.dm_exec_query_stats.
    Similarly, the number of executions for a single stored procedure should roughly match the number reported by SQL Server on sys.dm_exec_procedure_stats.

    I noticed that you are using an old version of Foglight.
    I strongly advise that you upgrade to the latest version which we just released: 5.7.5.35.
    It fixes some of the issue you mention and also includes new capabilities around performance troubleshooting.

    Regards
    Anat
  • Anat,

    Thank you! It pretty much confirms what I need to be looking at and how to interpret what I'm seeing.

    I thought the query stats were permissions protected from the developers, but it does look like I can see it from that on our production servers, so I'll cross reference them to try and get a better idea of what's going on. I've also confirmed we're actually on 5.7.5.5 with plans to upgrade when the .6 update comes out.

    Appreciate you taking the time to reply.