Resource Consumption in a customized dashboard

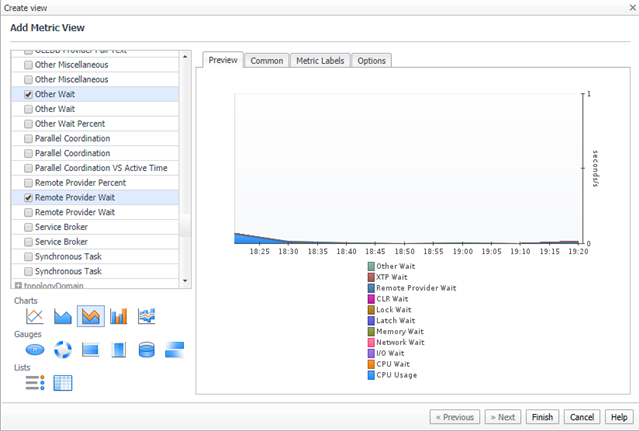
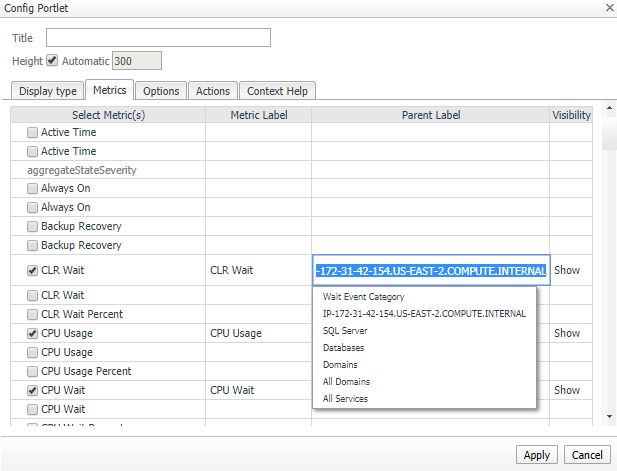
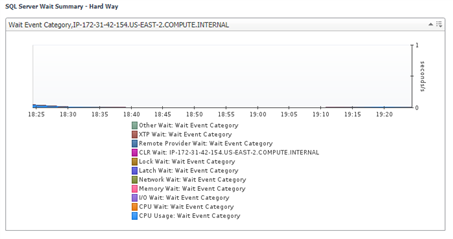
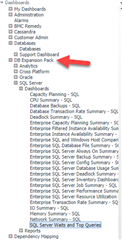
I'm looking to try to create a customized dashboard to show, perhaps, 9 of our instances and a corresponding "Resource Consumption" (from SQL PI) screen for each instance so we can seem them quickly at a glance.  The link below will explain what graph I'm trying to implement:

I've been at this for several hours and can't figure out how to get this accomplished.  Could someone give me an idea of how to take care of this?  Or is there another way to accomplish what I'm am trying to do?

Thanks!!

Parents
  • If you wanted to create something like this yourself, you could have done it "the hard way", as shown in the video below.  This would have involved dragging and dropping the 9 instances into your dashboard, similar to as above, but instead of dragging the "whole instance" over, you would navigate to the "Wait Events Category" metric grouping, and dragged the heading over.  Upon letting go, you would select "Select Metric", and checked off the metrics you wanted included as a stacked area graph.  In this example, you'd select CPU Usage, CPU Wait, IO Wait, Memory Wait, Network Wait, Latch Wait, Lock Wait, CLR Wait, Remote Provider Wait, XTP Wait, and Other Wait, and chosen the "stacked area" graph as shown in the screenshot below: 

    After you include your graph in the dashboard, so that the Instance name shows at the title of the graph, you need to modify the "Parent Label" field of the Metrics tab to include the instance name for at least one of the metrics.  It is not necessary to do this for all.

    After this has been done, you will have the graph for one instance.  Adding additional instances would be a "rinse and repeat" process, although you can save some steps by choosing "Use previous selection" when you drag the "Wait Event Category" metric grouping into your dashboard for a newly selected instance.

    Screencast Video:

    www.screencast.com/.../5PzXha71d1i

    The reason(s) I chose to leverage a View, instead of doing it this "hard way" were so that:

    1. I could have control over the color choices making them consistent between servers and consistent to the main PI dashboards.  If you do it the hard way as described in this post, the view would automatically assign colors and there would be no guarantee that they would be consistent.
    2. Making this a view, allows for easy portability to other dashboards that you may want to create.  You will notice in the 6.6.2 DB Expansion Pack, there is a SQL Server Dashboard called SQL Server Waits and Queries, that shows this view along with the Top SQL Statements for an instance on a single dashboard.

    Hope this helps!

  • This is very helpful, Jason!!  Thank you very much.
    Silly question though.  I'm not sure how to import the customized dashboard into Foglight.  I imported your db Expansion pack years ago, and quite frankly I don't remember how I did it.  Sorry for the "newb" question but I really couldn't find anything in these forums to show how to import a dashboard.

    Anyway you can either point me in the right direction or throw together a very quick video on it?

    Sorry for all the questions.  Just wish there was some good documentation on this stuff.  Thanks!!

  • No problem John... in order to install the Database Expansion Pack cartridge, take the following steps:

    1. Unzip the .zip file.  Inside of the zip should be a single file with a .car extension.
    2. Navigate to the Administration -> Cartridges -> Cartridge Inventory dashboard as shown below:
    3. Click on the Install Cartridge button shown below, and point to the .car file that you extracted in step 1.
    4. After the installation finishes successfully, you may have to refresh your browser, but you should see a DB Expansion Pack "folder" in your left hand navigation menu.  That folder contains dashboards and reports across a few different platforms/categories.

    Let me know if you have any further questions!

Reply
  • No problem John... in order to install the Database Expansion Pack cartridge, take the following steps:

    1. Unzip the .zip file.  Inside of the zip should be a single file with a .car extension.
    2. Navigate to the Administration -> Cartridges -> Cartridge Inventory dashboard as shown below:
    3. Click on the Install Cartridge button shown below, and point to the .car file that you extracted in step 1.
    4. After the installation finishes successfully, you may have to refresh your browser, but you should see a DB Expansion Pack "folder" in your left hand navigation menu.  That folder contains dashboards and reports across a few different platforms/categories.

    Let me know if you have any further questions!

Children