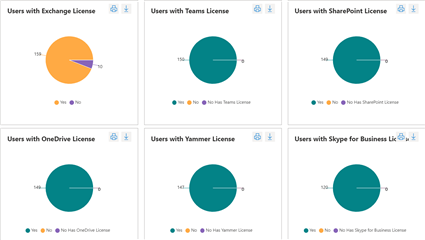
This report shows how licenses are distributed across your organization. It includes a series of pie charts showing users who have and don’t have licenses for different workloads. You can customize this report to fit your needs by editing it and adding/removing workloads. For example, if your organization doesn’t use Skype for Business, you could edit the report and remove that pie chart.
What questions does this report address?
How many users have access to a certain workload?
Sometimes you might be asked to provide data about how many users have access to various workloads. This report gives you a quick overview that you could share with stakeholders.