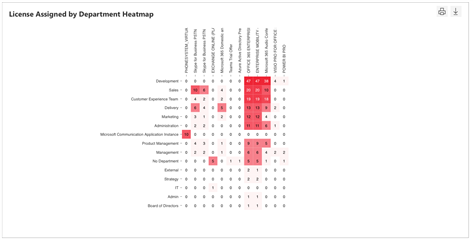
This heat map shows the number of assigned license types throughout the department. The X axis of the heat map is the assigned license set, and the Y axis is the department.
The department is limited to 100 results. If there are more than 100 departments, those over 100 are summarized in the Other section. You can configure the report to show fewer or more departments. Or, you could limit the report to departments in a specific country by creating an additional filter.
What questions does this report address?
How many licenses of each type are allocated to each department?
Use this report to determine how licenses are distributed across the organization. This report is also helpful if your organization is using, or considering, any kind of charge-back model.