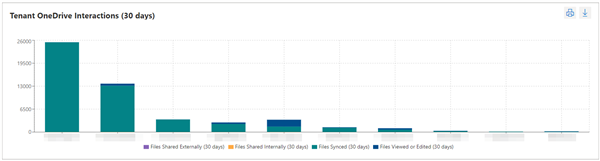
This stacked column graph shows the total amount of interactions each user within your tenant has completed within the previous 30 days. You can hover over each column to get specific data for that user.
Note that this chart is sorted by files synced. However, you can modify that to sort by either files shared externally, files shared internally or files viewed or edited by using the drop down menu.
What questions does this report address?
Which users are interacting with OneDrive the most?
This report is useful if you are looking for the users who use OneDrive with great efficiency, or identify those who may need assistance with adopting the workload.