A customer recently asked if there was a way to get some network device availability metrics and service status to show up alongside application-oriented metrics from their e-commerce applications. They already had the service for the e-commerce application defined in the Foglight Service Builder.
We introduced them to the NetMonitor agent. This agent takes a list of devices and pings them periodically to track response time and availability. Optionally, you can have it perform a traceroute.
The struggle was getting the NetMonitor data to show up when adding them to the service definition.
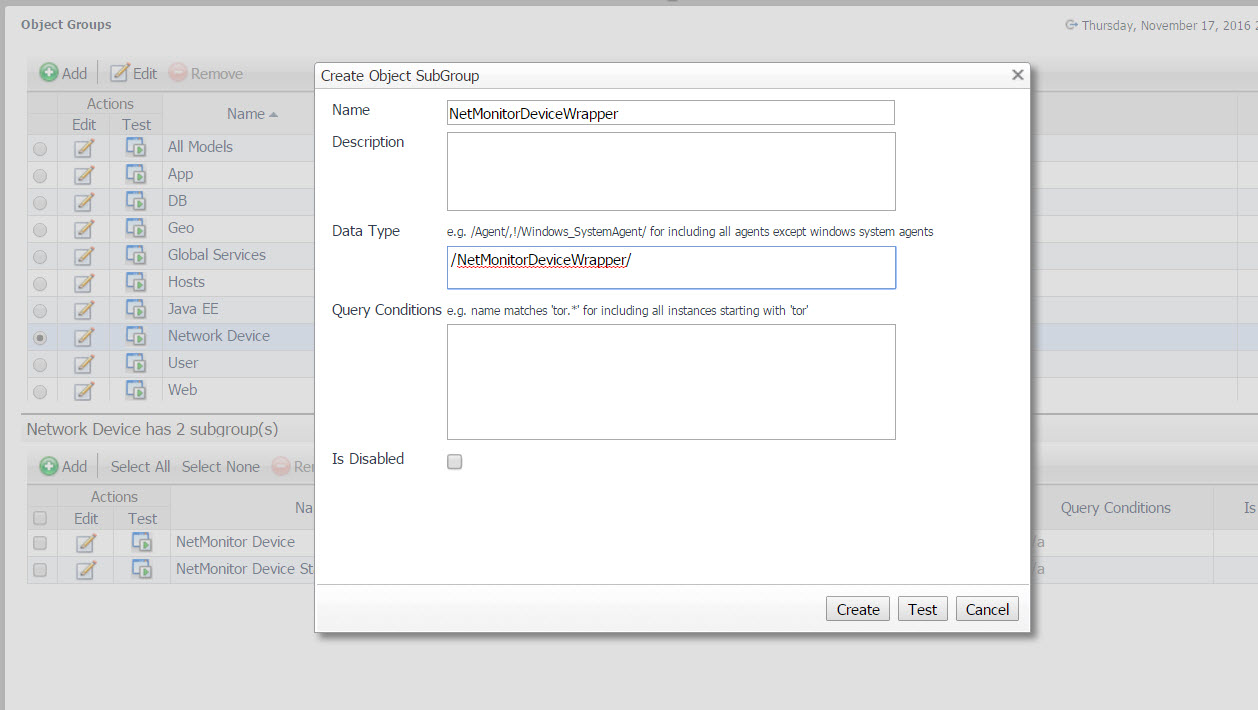
Start by navigating to Services -> Object Groups. Click the top Add button and give the group a name like "Network Device."
Next, add a sub-group by clicking the bottom Add button. The Data Type will be /NetMonitorDeviceWrapper/ .
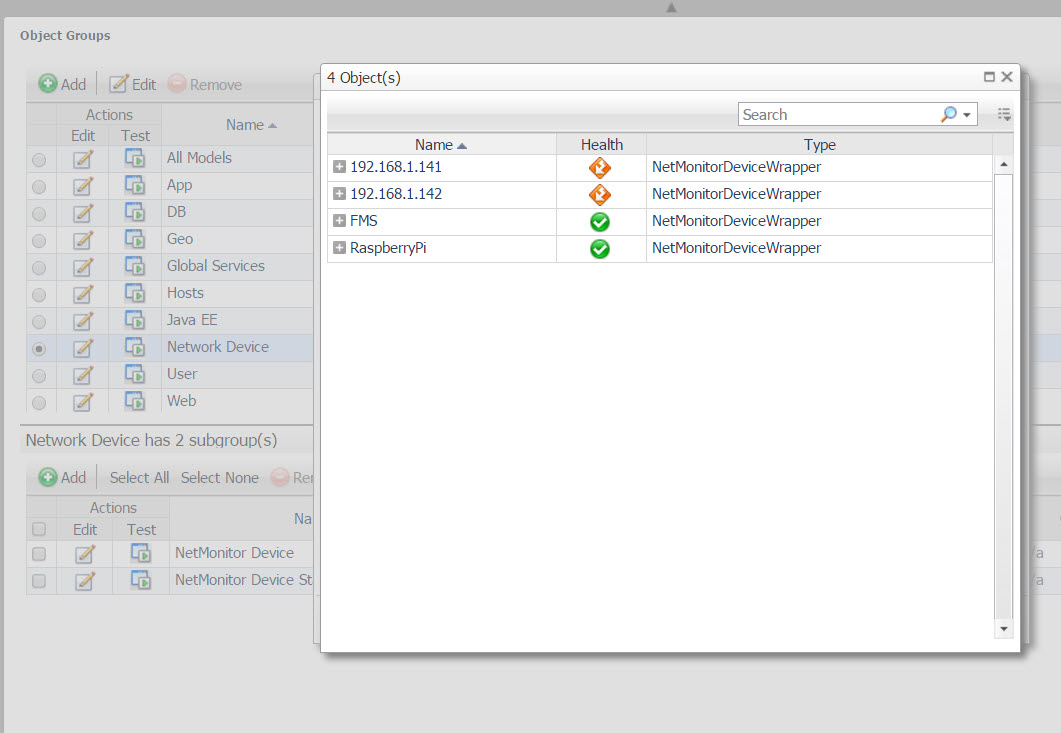
You can click the Test button to verify that you get a list of devices back that are monitored by NetMonitor. These should show the "friendly" name of the device if you used a value in the device name override.
Now when you add a component to a service definition via the Service Builder dashboard, you can pick "Network Device" from the dropdown and optionally search by wildcard for your desired device(s).
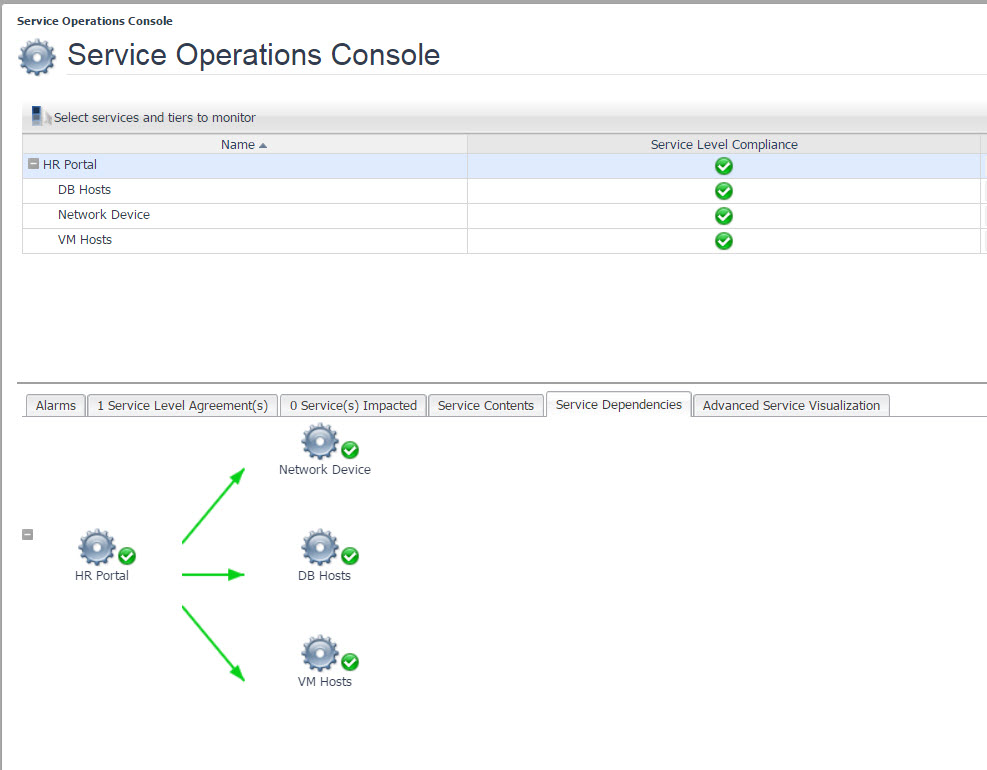
The end result is that you can have your network devices appear in the Dependencies tab of the Service Operations Console to view them in context with other monitored objects.