
Whether it’s hitting sys.dm_io_virtual_file_stats DMV with calculated queries, collecting Perfmon Disk Counter statistics, reviewing Resource Monitor Disk information, or keeping your storage admin close by, I/O issues are all too familiar a concern. In order to avoid the dreadful end-user calls reporting slow response time and timeouts, I/O issues need to be addressed timely and effectively. As we all know, a high performing I/O subsystem is the back bone of any efficient SQL Server configuration. During its normal processing, the SQL Server constantly brings database pages in and out of the buffer pool creating I/O traffic. Meanwhile, system DBAs continuously strive to reduce read/write stall times (latency) in order to avoid SQL Server performance issues.
In Spotlight, a sustained high I/O Stall alarm is a good indicator that you could have a disk subsystem bottleneck and that I/O device service times will be reduced. That’s where Spotlight’s alarms come into play as a superhero rescuer to automatically notify you on any database file that exceeds the designated I/O wait time and so much more.
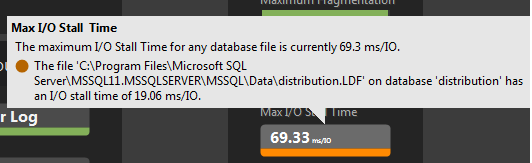
The alarm notification displays the database name containing the file with the highest I/O stall time. Upon diagnosing the raised alarm, Spotlight directs you to several grids with drilldown capability that display more granular detail, such as each database files and areas of concern including wait types. The Diagnostics, SQL Activity | I/O by File and Workload Analysis drilldowns can help identify which process is generating high amounts of I/O activities.
Essentially Spotlight utilizes data from io_stall_read_ms and io_stall_write_ms amongst other columns in sys.dm_io_virtual_file_stats DMV for its alarm related computations. A wait time is calculated by taking the difference between two samples and dividing by the time interval between the samples. In general, when the Home Page or diagnostic drilldowns are open Spotlight refreshes data every 15 seconds, otherwise data collection is based on background rate as it appears in the Scheduling dialog (every 1 minute).
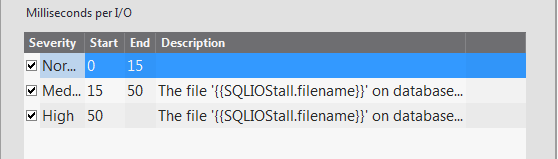
The I/O Stall Time alarm threshold uses an average derived after 5 collections, which means that it varies depending on whether the Spotlight Home page is opened or not. Each alarm displays the maximum value of the latest collection. Alarm default thresholds in milliseconds:
Let’s take a look at Spotlight diagnostics drilldown displays:
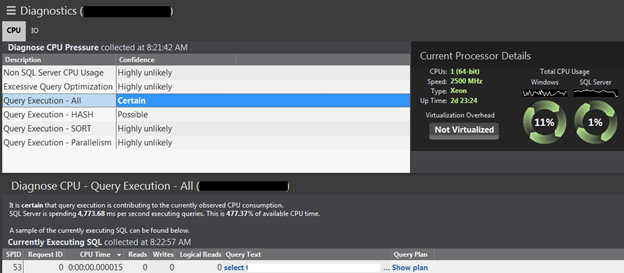
CPU Pressure Diagnostics and Current Processor Details:
It displays the possible causes of CPU pressure and the likelihood that one of them is contributing to high CPU usage on the server being monitored. Clicking an item in the grid will display an explanation of the diagnosis and supporting information. Grid also provides the processor details and current CPU usage.
For example, here we have a SQL transaction with CPU consumption concerns:
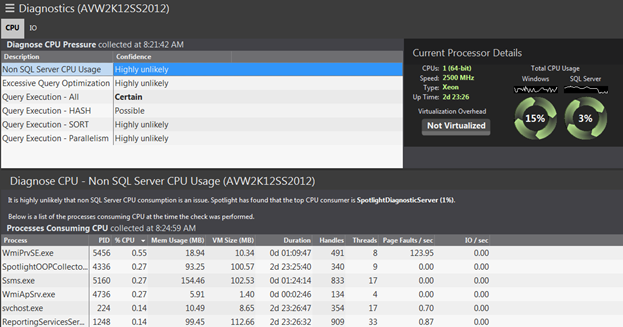
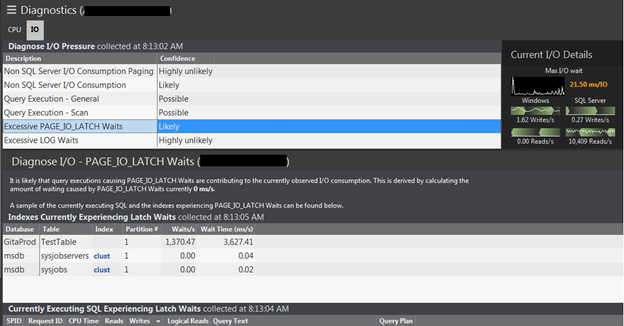
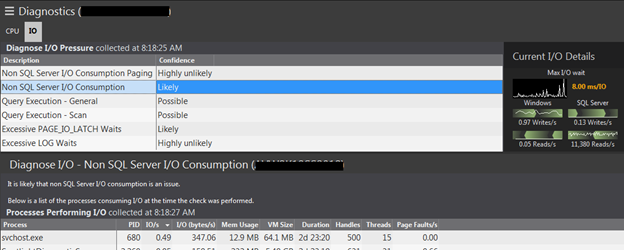
I/O Pressure Diagnostics and current I/O Details:
Displays the possible causes of I/O pressure and the likelihood that each is contributing to the currently observed I/O consumption. Click an item in the grid to display an explanation of the diagnosis and supporting information. Grid also displays details of the current I/O consumption.
For example, here we have a Wait Type causing the I/O issue:
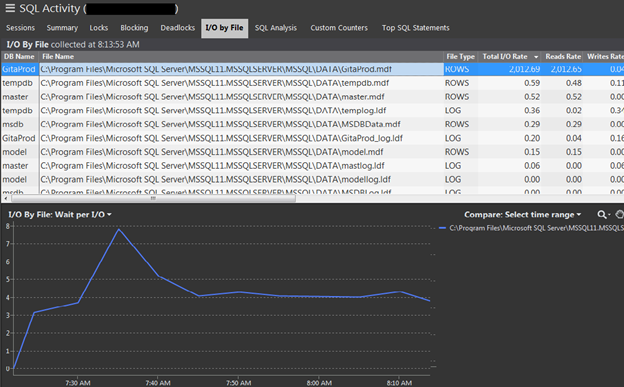
But the diagnostics doesn’t have to stop here. You can gain even more access to the underlying causes of issue by looking at the SQL Activity's "I/O by File" drilldown:
Analyze Logical and Physical Reads in Workload Analysis drilldown: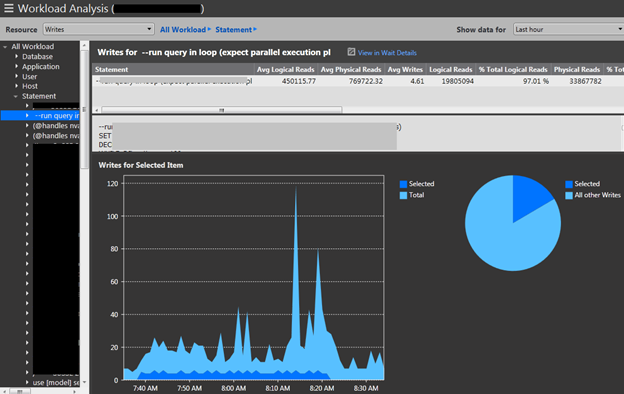
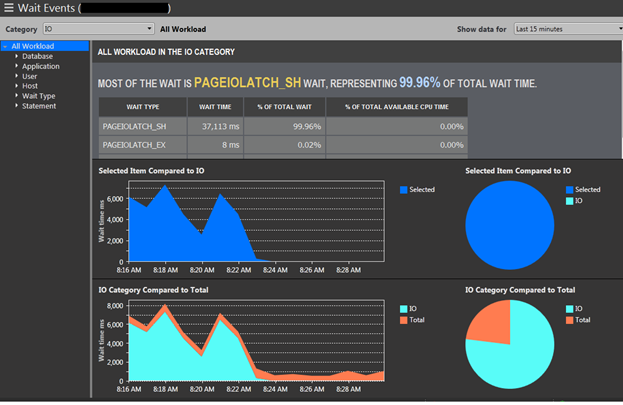
Analyze IO resource in Wait Event drilldown:
So let Spotlight come to your rescue. Download a free trial edition of latest Spotlight release from here or drop us a note here or at our user Forum.


