A customer recently asked me for help building a simple dashboard that showed a specific process name and associated resource usage. They wanted to provide a single view to end users instead of having them go through the default dashboard's workflow.
This post will cover the out of the box dashboards that are enabled with collecting processes with the Windows and Unix system agents.
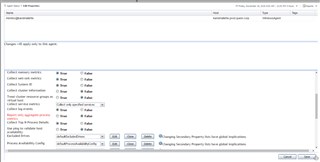
The first step is to make sure that "Report only aggregate process metrics" in the agent properties is set to false.
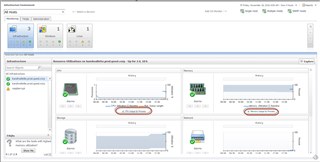
To get down to the process level data, you can click the links for CPU Usage by Process and Memory Usage by Process in the main Infrastructure dashboard.
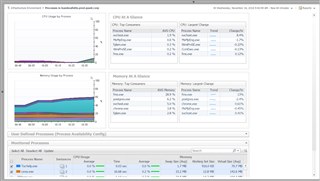
That will take you to a dashboard with process level details.
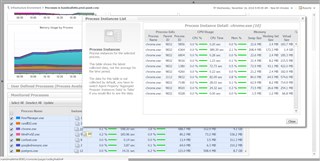
In the lower panel, there will be a table of aggregate processes. Clicking on the number in the Instances column will bring up a list of individual process instances.
In Investigating Processes with Foglight Part 2, we will look at creating a simple dashboard with metrics for a specified process name.
For more information, visit Foglight Performance Monitoring.


