
In Investigating Processes with Foglight - Part 1, we looked at the default dashboards that give us insight into processes and their performance metrics on a host.
A customer wanted a simple dashboard to display metrics on a specific process, without having to get the end user to drill down through the out-of-the-box dashboards.
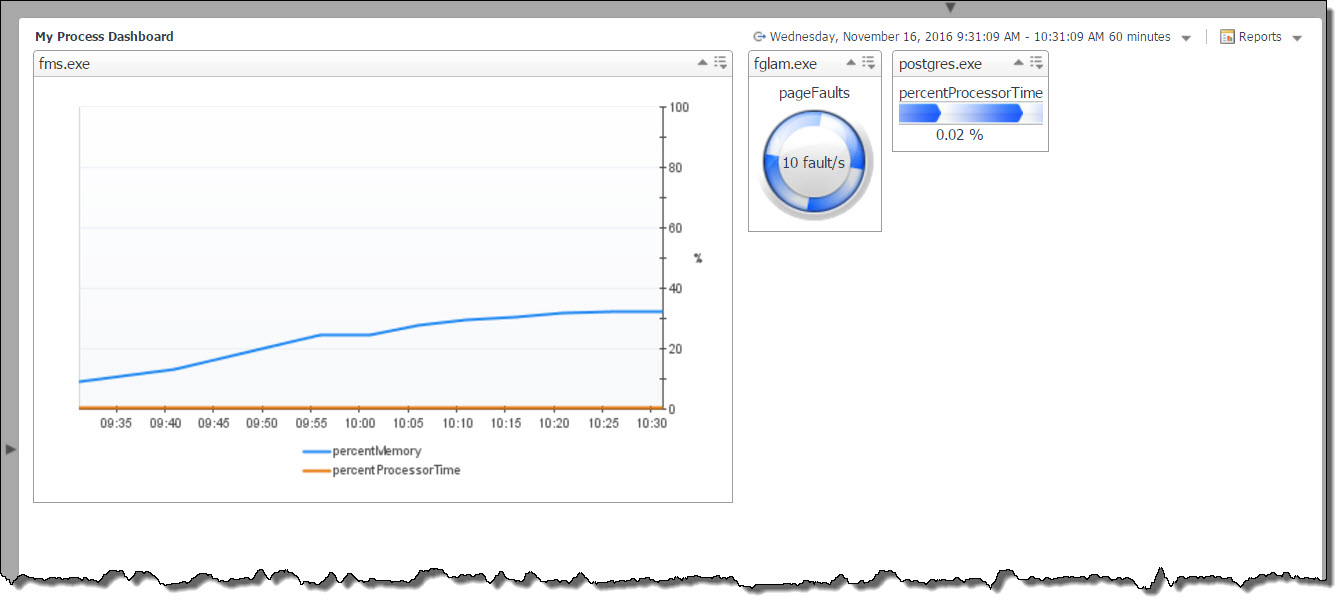
Here is an example of the final dashboard. Of course with Foglight, these are only limited by your imagination.
To start, we used the right-hand panel to Create a Dashboard. You can specify the properties as you wish. I went with a fixed size layout in this example.
From there, you can navigate in the Data tab down to the Processes tree. This is found under Hosts -> All Hosts -> [your host name] -> os -> processes.
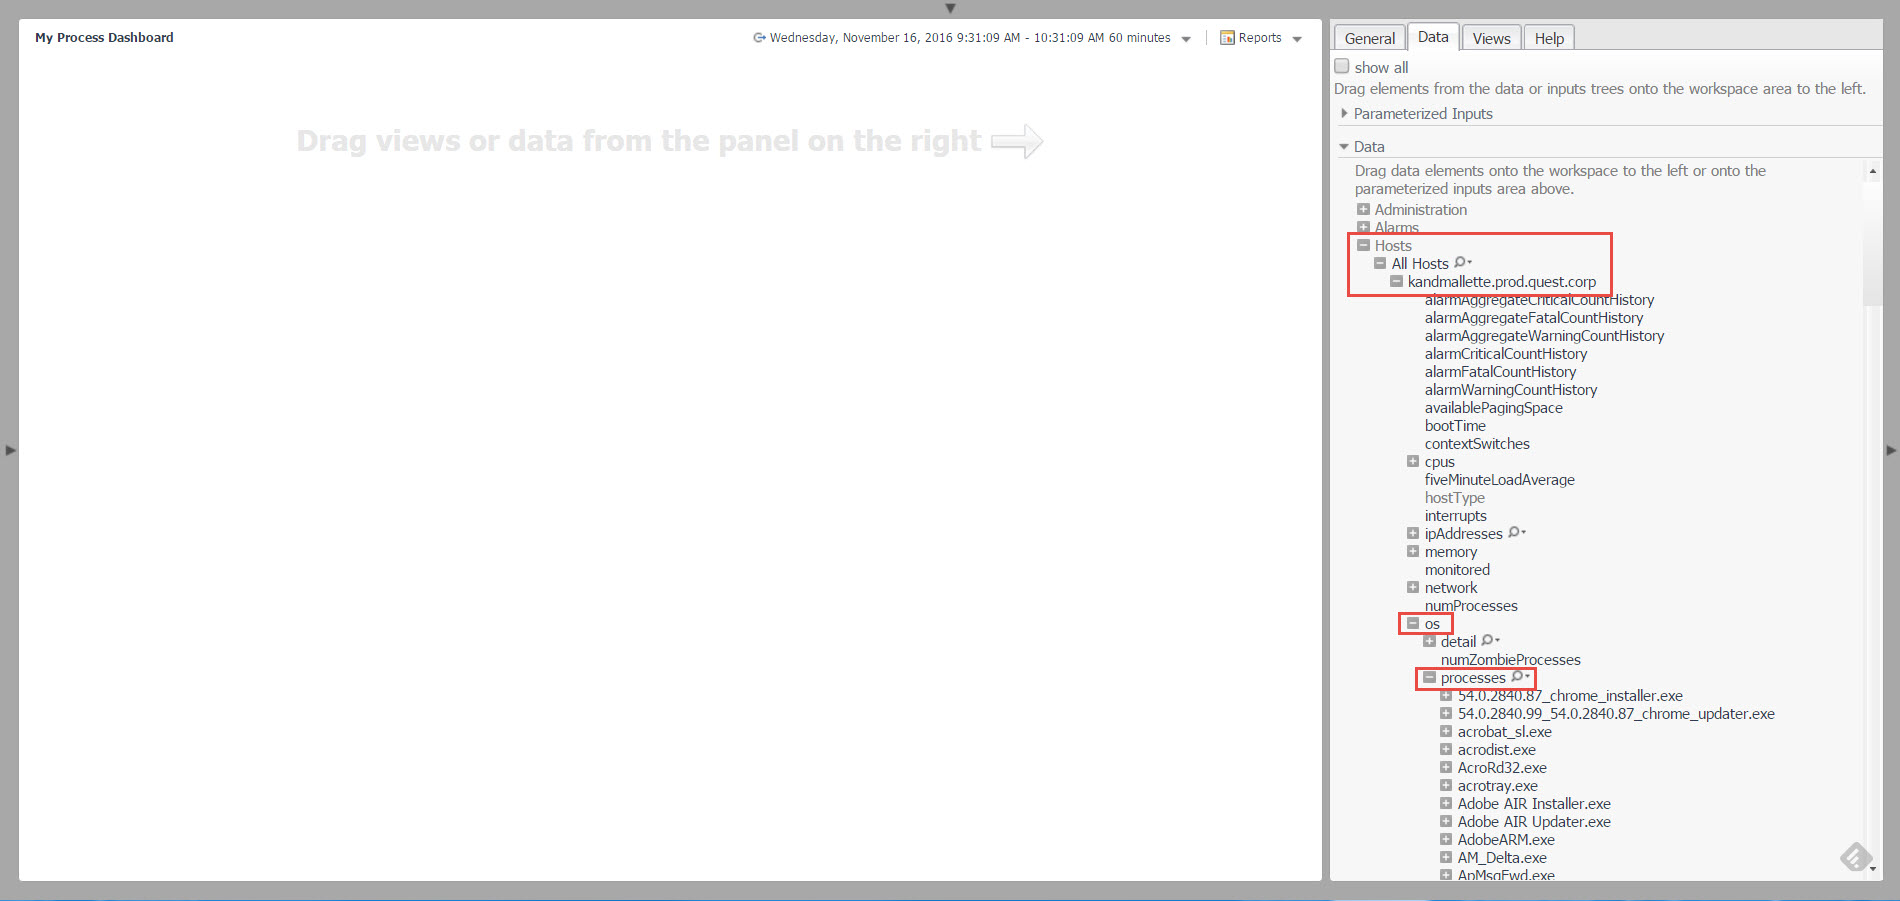
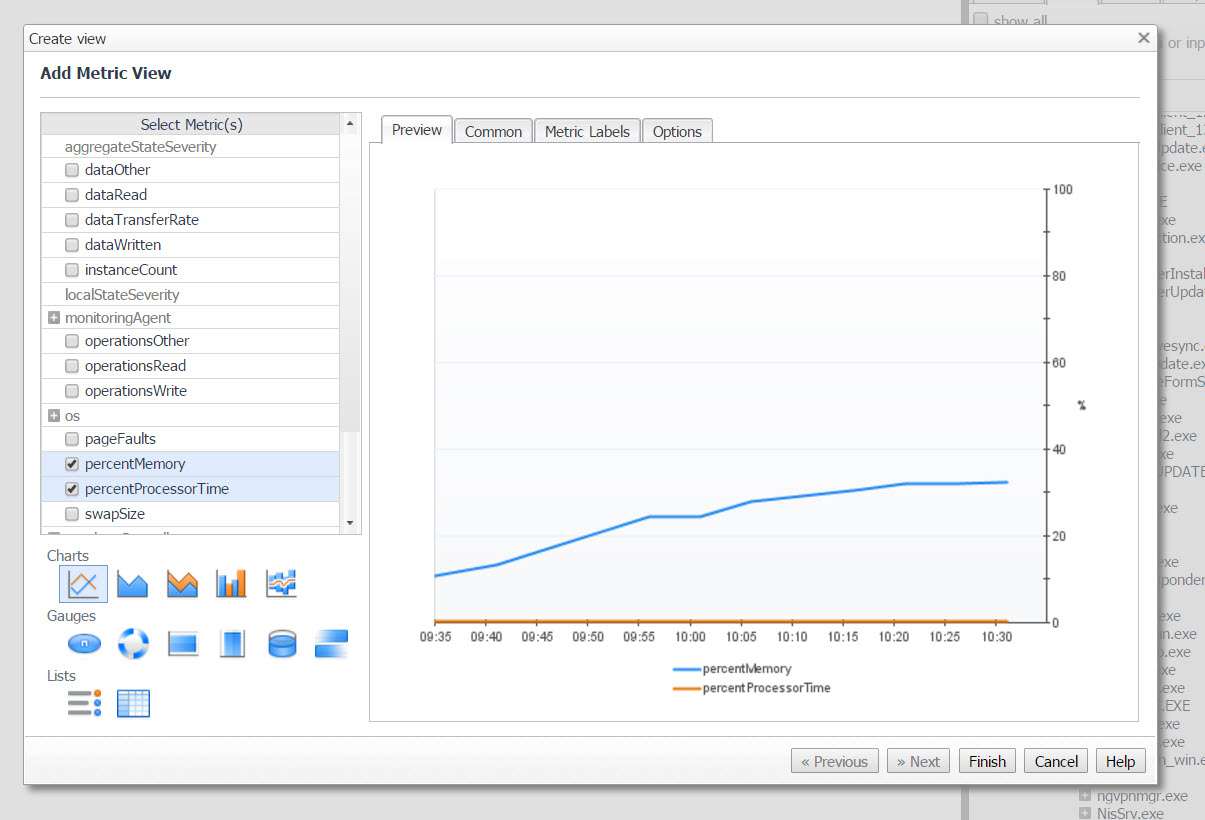
Select the process you wish to graph and drag it to the left onto the canvas. You can then select from a list of available metrics and specify the chart or gauge type.
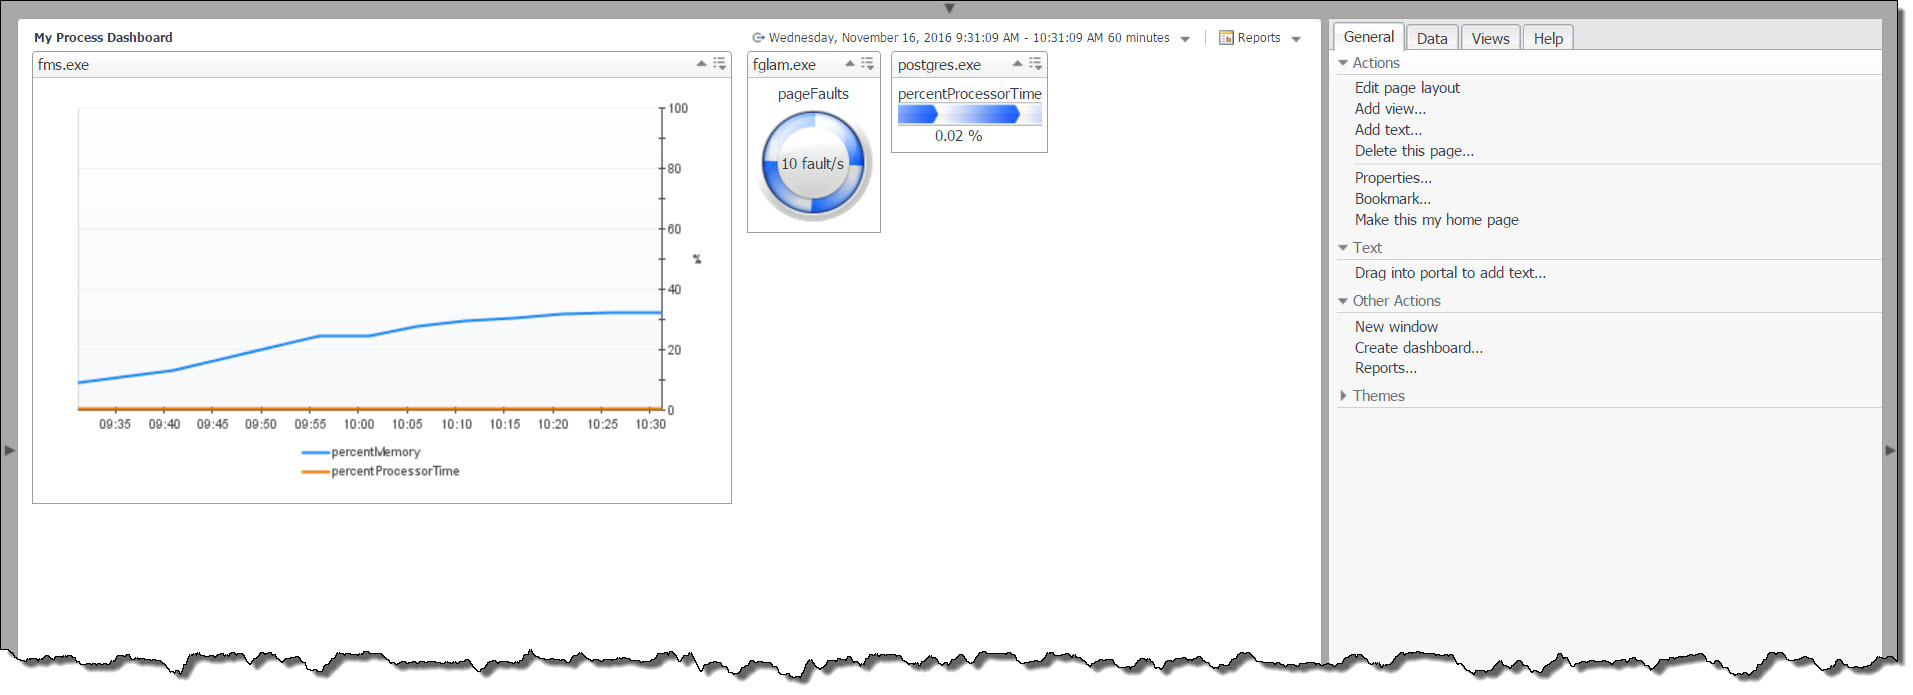
You can grab additional processes, or any other data to complete your dashboard. I normally start by "throwing" metrics on to the canvas, and finish up by using the Edit Page Layout option on the General tab to finalize the layout and look.
For more information, visit Foglight Performance Monitoring.
