

On my farm, I have a fairly large irrigation system (7 zones and a pump), all controlled by a Raspberry Pi single-board computer. I also have Raspberry Pi controllers for Amateur Radio activities, including a Weak Signal transmitter that uses only the Raspberry Pi to generate a radio signal that’s been heard around the world.
The radios and irrigation controllers are mounted outside, in weather-proof boxes. Unfortunately, weather-proof means that there’s no way cool the Raspberry Pi or other components. Since, we live in the high desert in Eastern Washington, where daytime temperatures can get to over 100 F, I was concerned that the CPUs would overheat and stop functioning. Looking at the processor data sheets for the ARM processor used by the Pi, I discovered that the temperature limits for the CPU are -25 to +80 C.
Fortunately, it’s easy to read the Pi CPU temperature with a simple Python script, listed here:
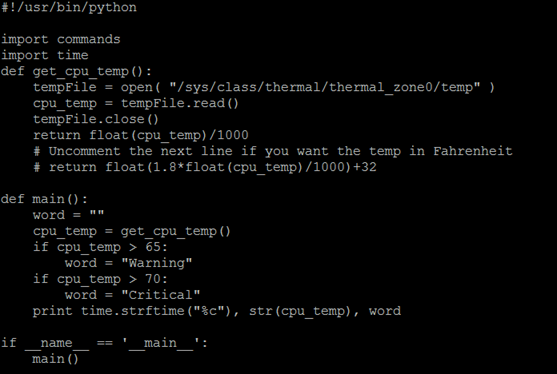
From a Linux server that’s also running a Foglight Agent Manager (FglAM) we can then call the Python script from a shell script:
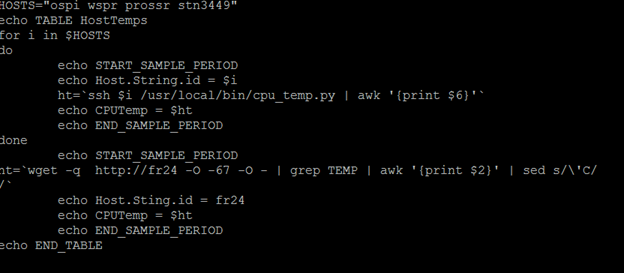
This shell script outputs the temperature (in degrees C) for each of the hosts listed. Here’s a sample of the output:
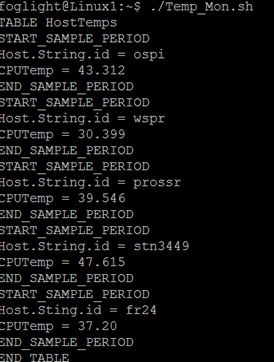
The TABLE and SAMPLE_PERIOD commands are used by the Script Agent processor built into the Foglight Agent Manager to define a User Table to Foglight. With the Script Agent Builder, this script can be integrated into Foglight and then used to display graphs or generate alarms. For information on how to build custom script agents, see these links:
Custom Agents - Intro to Script Agents
Custom Agents - Script Agent Data Modeling and Units
Here’s a dashboard that shows the CPU Temperatures over time:
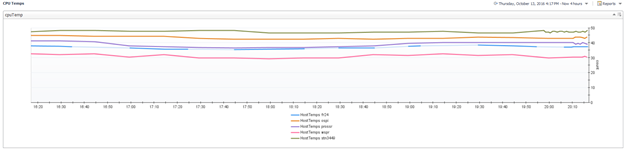
As you can see, all of the CPUs are comfortably cool. Over the last summer, even with ambient air temperatures over 100 degrees, all of the CPUs stayed well under 75 C. Since the data’s now in Foglight, it can be manipulated and displayed, just like any other Foglight Metric.
In the next blog, I’ll show you how to create the dashboard above, and how to create alarms from the data collected.

