
The data that we get in Foglight Performance Investigator for SQL Server and Oracle is shown on the default dashboards to provide actionable insights. But sometimes you want to get a bit more granular.
There was a report in the deprecated Performance Analysis that showed wait events broken down by hour.
A customer recently asked me to duplicate the report using the Performance Investigator data.
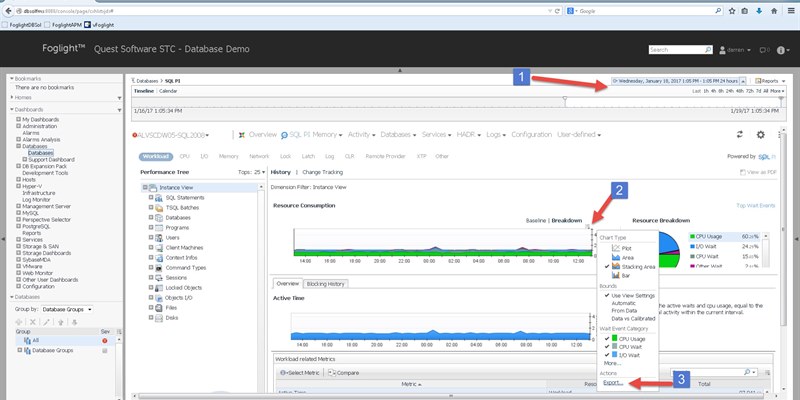
There is a manual way to do that today, while it is coming as a standard report later in 2017. To start, bring up the Performance Investigator dashboard, and select the time range that you want the data for (step 1).
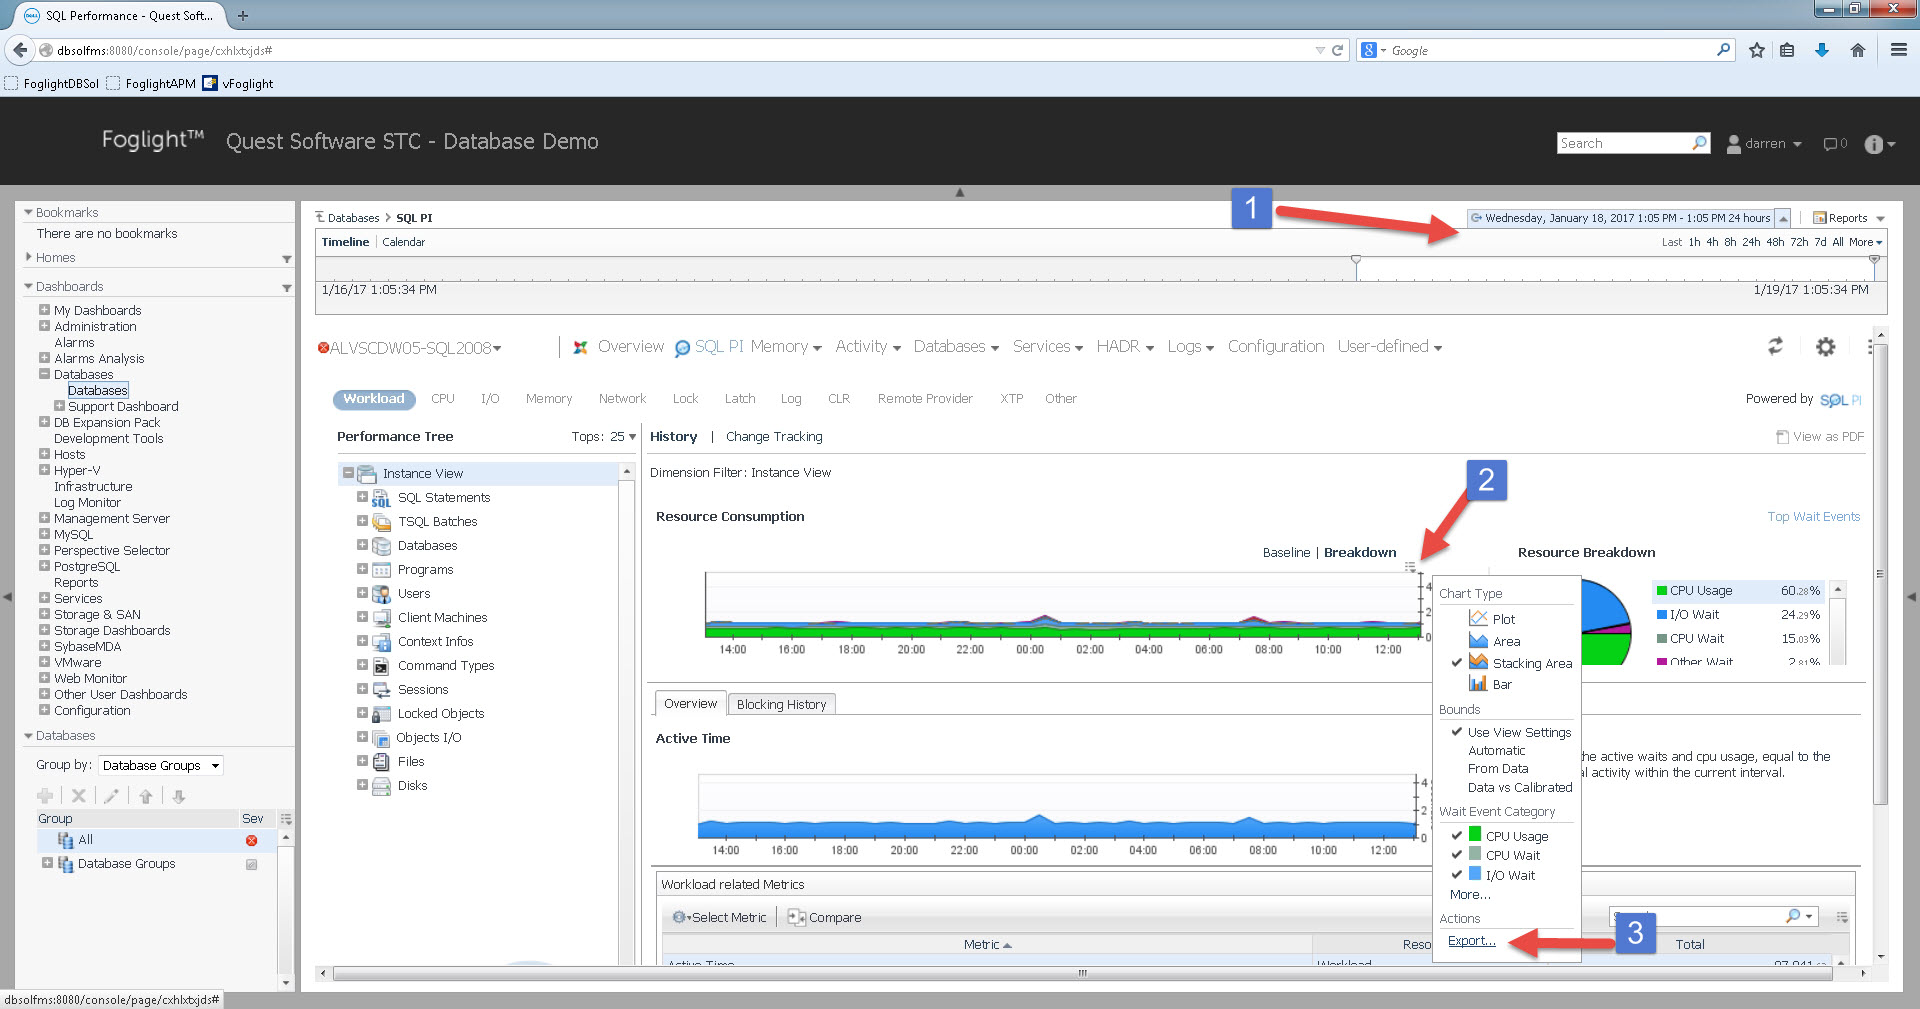
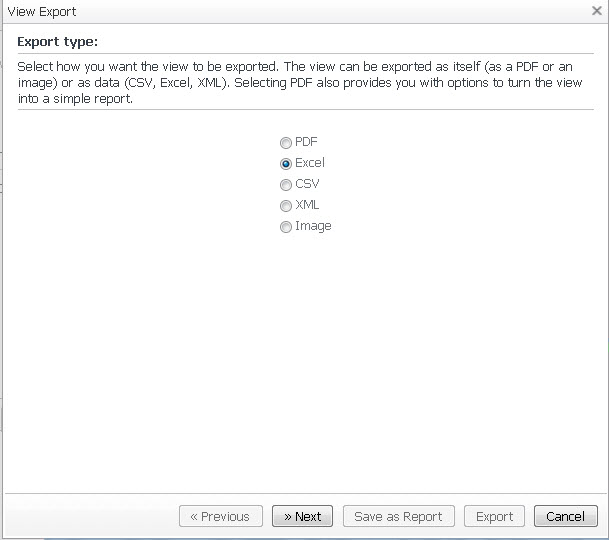
Mouse over (step 2) for the customizer to appear and select the Export option at the bottom. Pick "Excel" in order to get an export of the data broken down by time buckets.
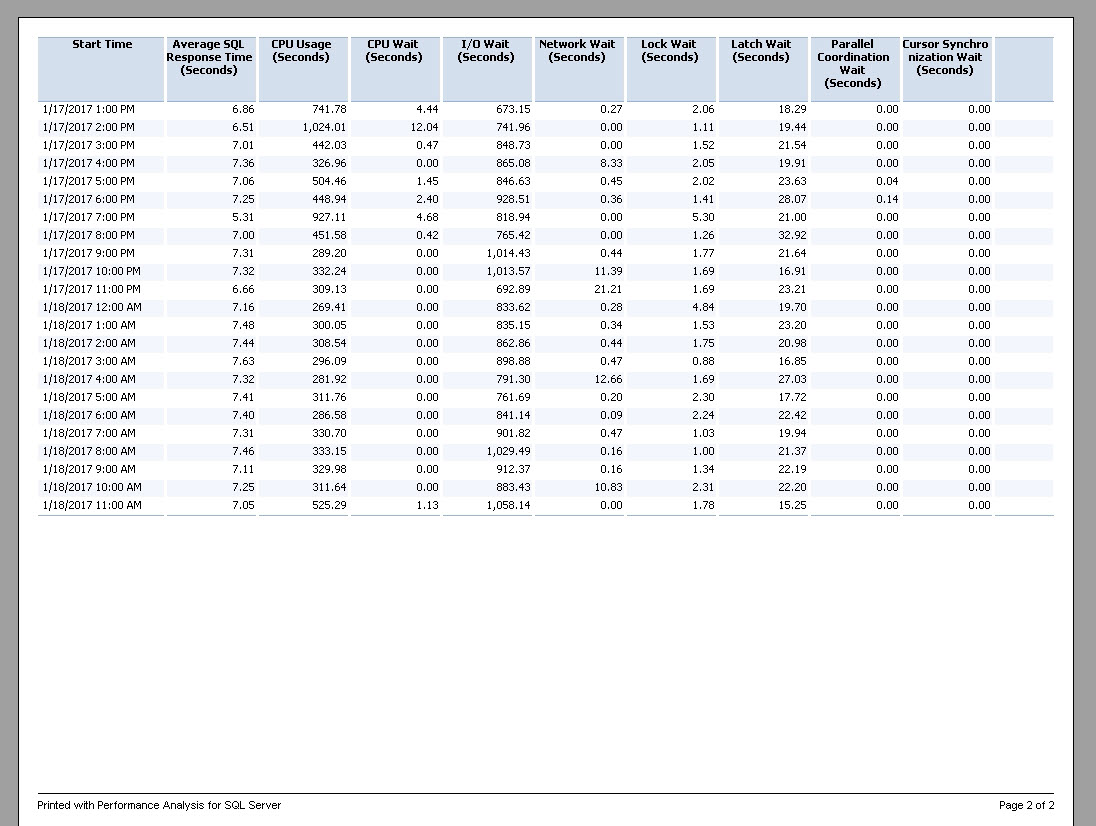
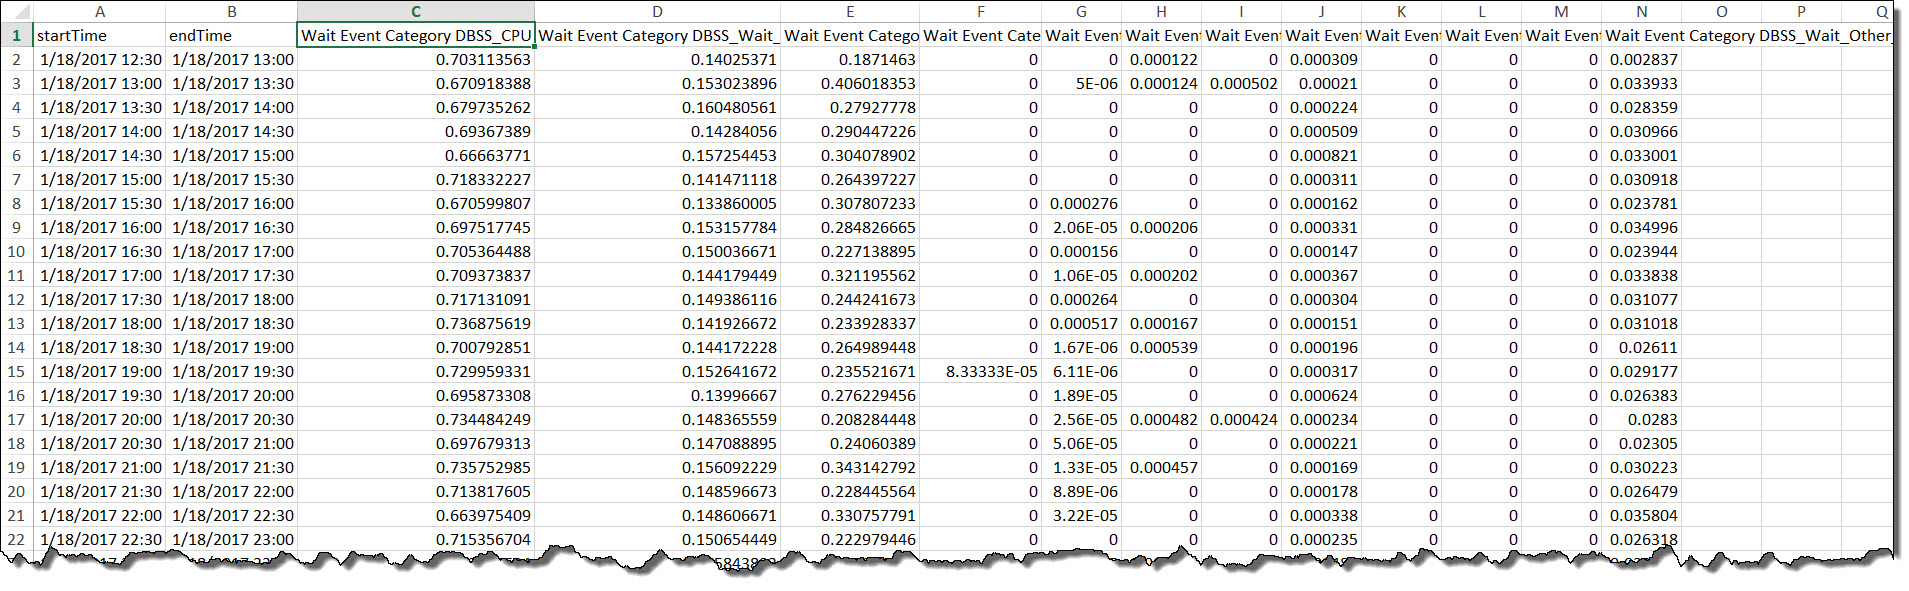
Here is what the end result looks like in Excel.
View more information for Foglight performance monitoring.