
Quest has recognized the growing importance of APIs and has taken steps to ensure they are properly addressed in the most recent versions of Foglight. It’s a great way to augment Foglight’s Virtualization and database performance monitoring so that correlations to the health of a host and/or database can be correlated to the performance of their transactions. This is an area of interest that I will be spending time on over the next few months with support through Web Traffic Analysis.
Foglight’s Traffic Analyzers measure HTTP/HTTPs traffic in real time. The traffic stream is intercepted as it crosses between the consumer and provider. This type of collection doesn’t impact any of the application’s performance because it acts like a phone tap where it gets a copy of the traffic in route but does nothing to impede the flow of the traffic. This is often called network tapping or wire sniffing.
The Foglight HTTP/HTTPS traffic analyzer is unique for several reasons. First, it aggregates the traffic metrics for reporting purposes and the aggregation filters are able to filter on anything in the request or response of the API call. This is in contrast to other HTTP/HTTPS that only allow filtering on the URL itself. URL filtering alone does not work for API calls, because the important context often lies in the request variables that are appended on the URL or embedded in the content.
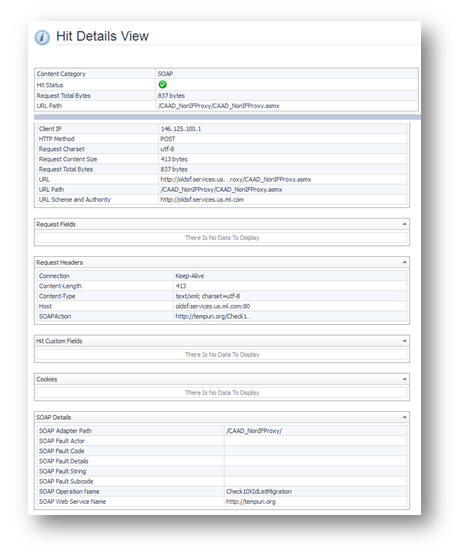
Second, Foglight stores the request and response of every API call in its entirety. This includes the full request header and body plus the full response header and body. This information has proven to be useful in diagnostics use cases. Where many monitors tell you that a problem is occurring Foglight tells you why. This is only possible when all of the trace evidence is persisted.
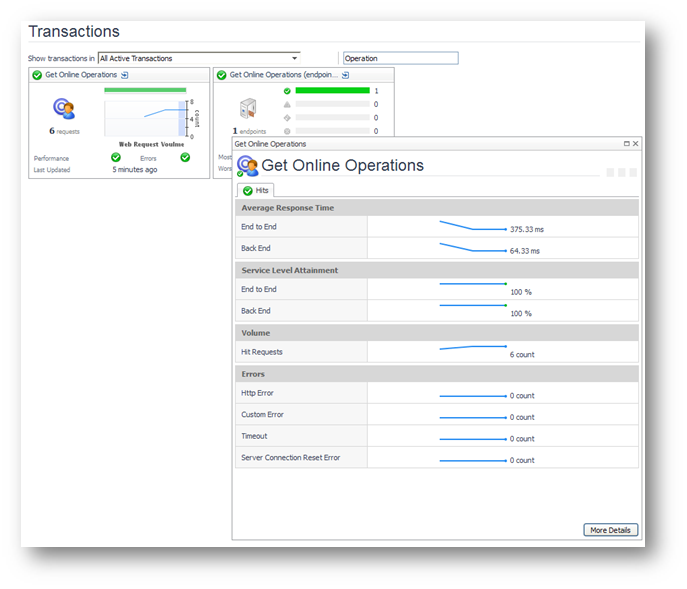
Finally, the Foglight traffic analyzer is not a sampling collector. It collects and analyzes 100% of the traffic 100% of the time. The views below show a transition from high level aggregates to low level trace details.
As you can imagine, when grabbing traffic in this manor, performance measurements are just the tip of the iceberg. Since we have the entire request and response including the content, we have a world of data that we can explore. I have gone more into depth on these types of API monitoring topics in a webcast titled, Getting Your DevOps on for the Enterprise. It will show some use cases with advanced scripting and analytics. While this type of monitoring is meant for all HTTP/HTTP analysis, the presentation and demonstration specifically focuses on API traffic.
