
Capture the SQL performance metrics that are uniquely important to your environment
Spotlight on SQL Server arrives ready to collect and alert on all of the key SQL Server performance indicators that most enterprises need to know about. The out-of-the-box collections are pre-configured with alert levels that make sense for most shops, and can be customized (as described here) if you have different preferences.
With this post, we’ll take Spotlight customization even farther by adding completely new metrics to Spotlight’s collection routine, and then specifying alarm levels and actions (such as email alerts) on our new metrics.
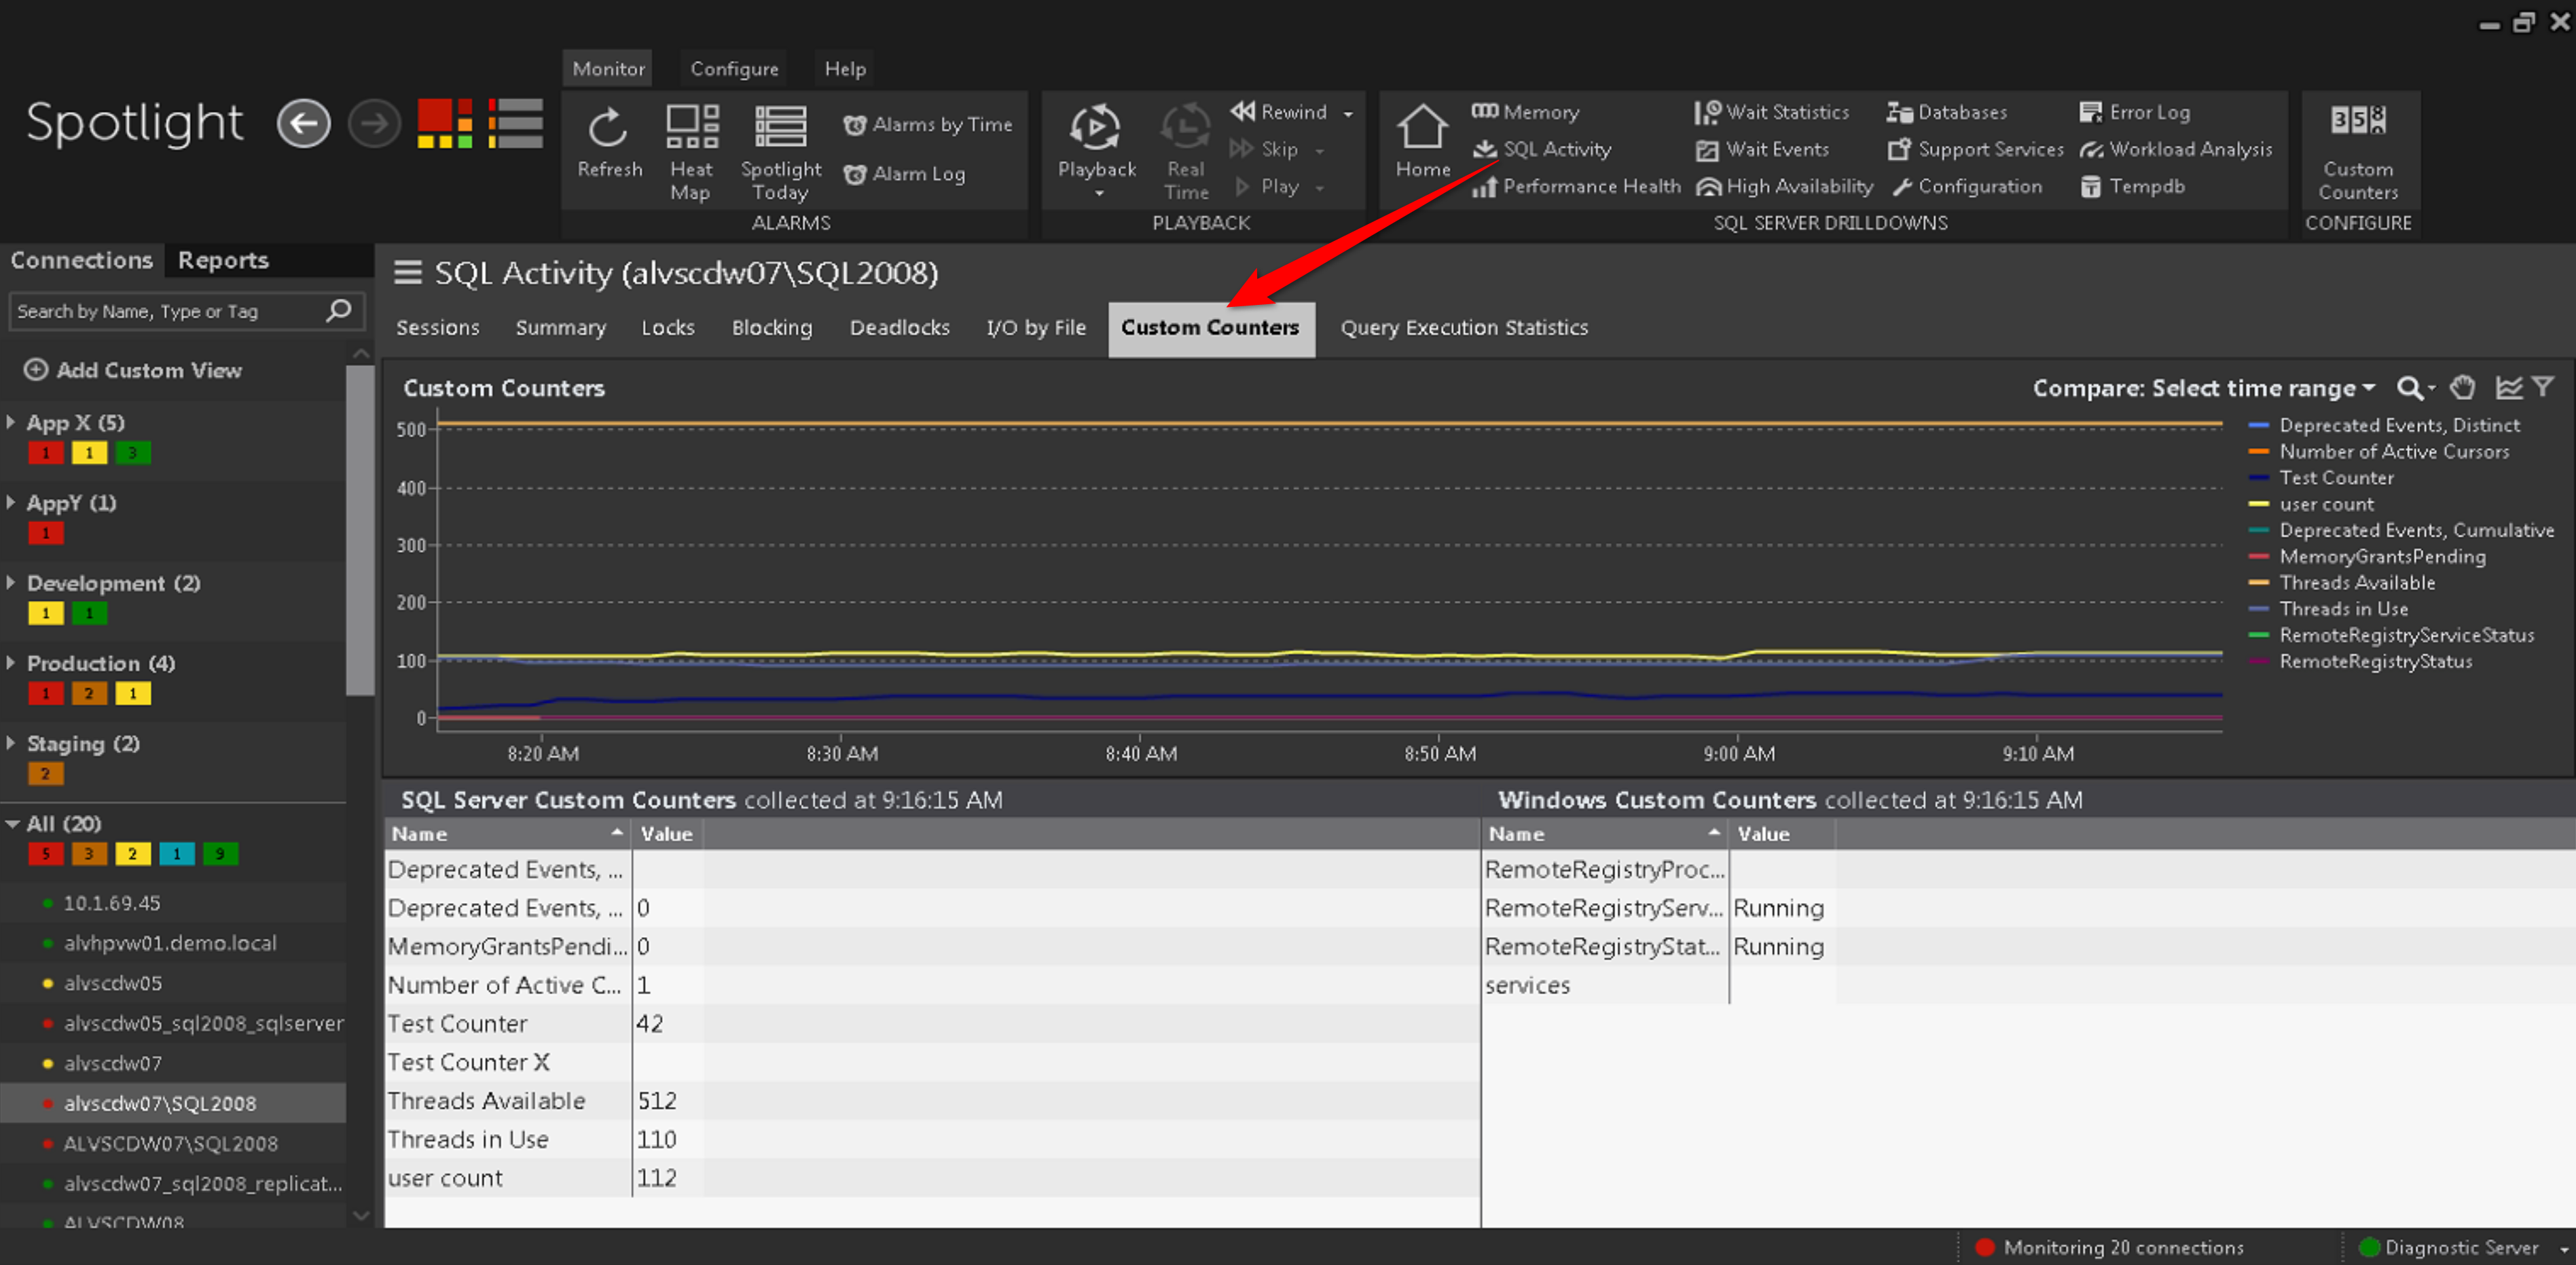
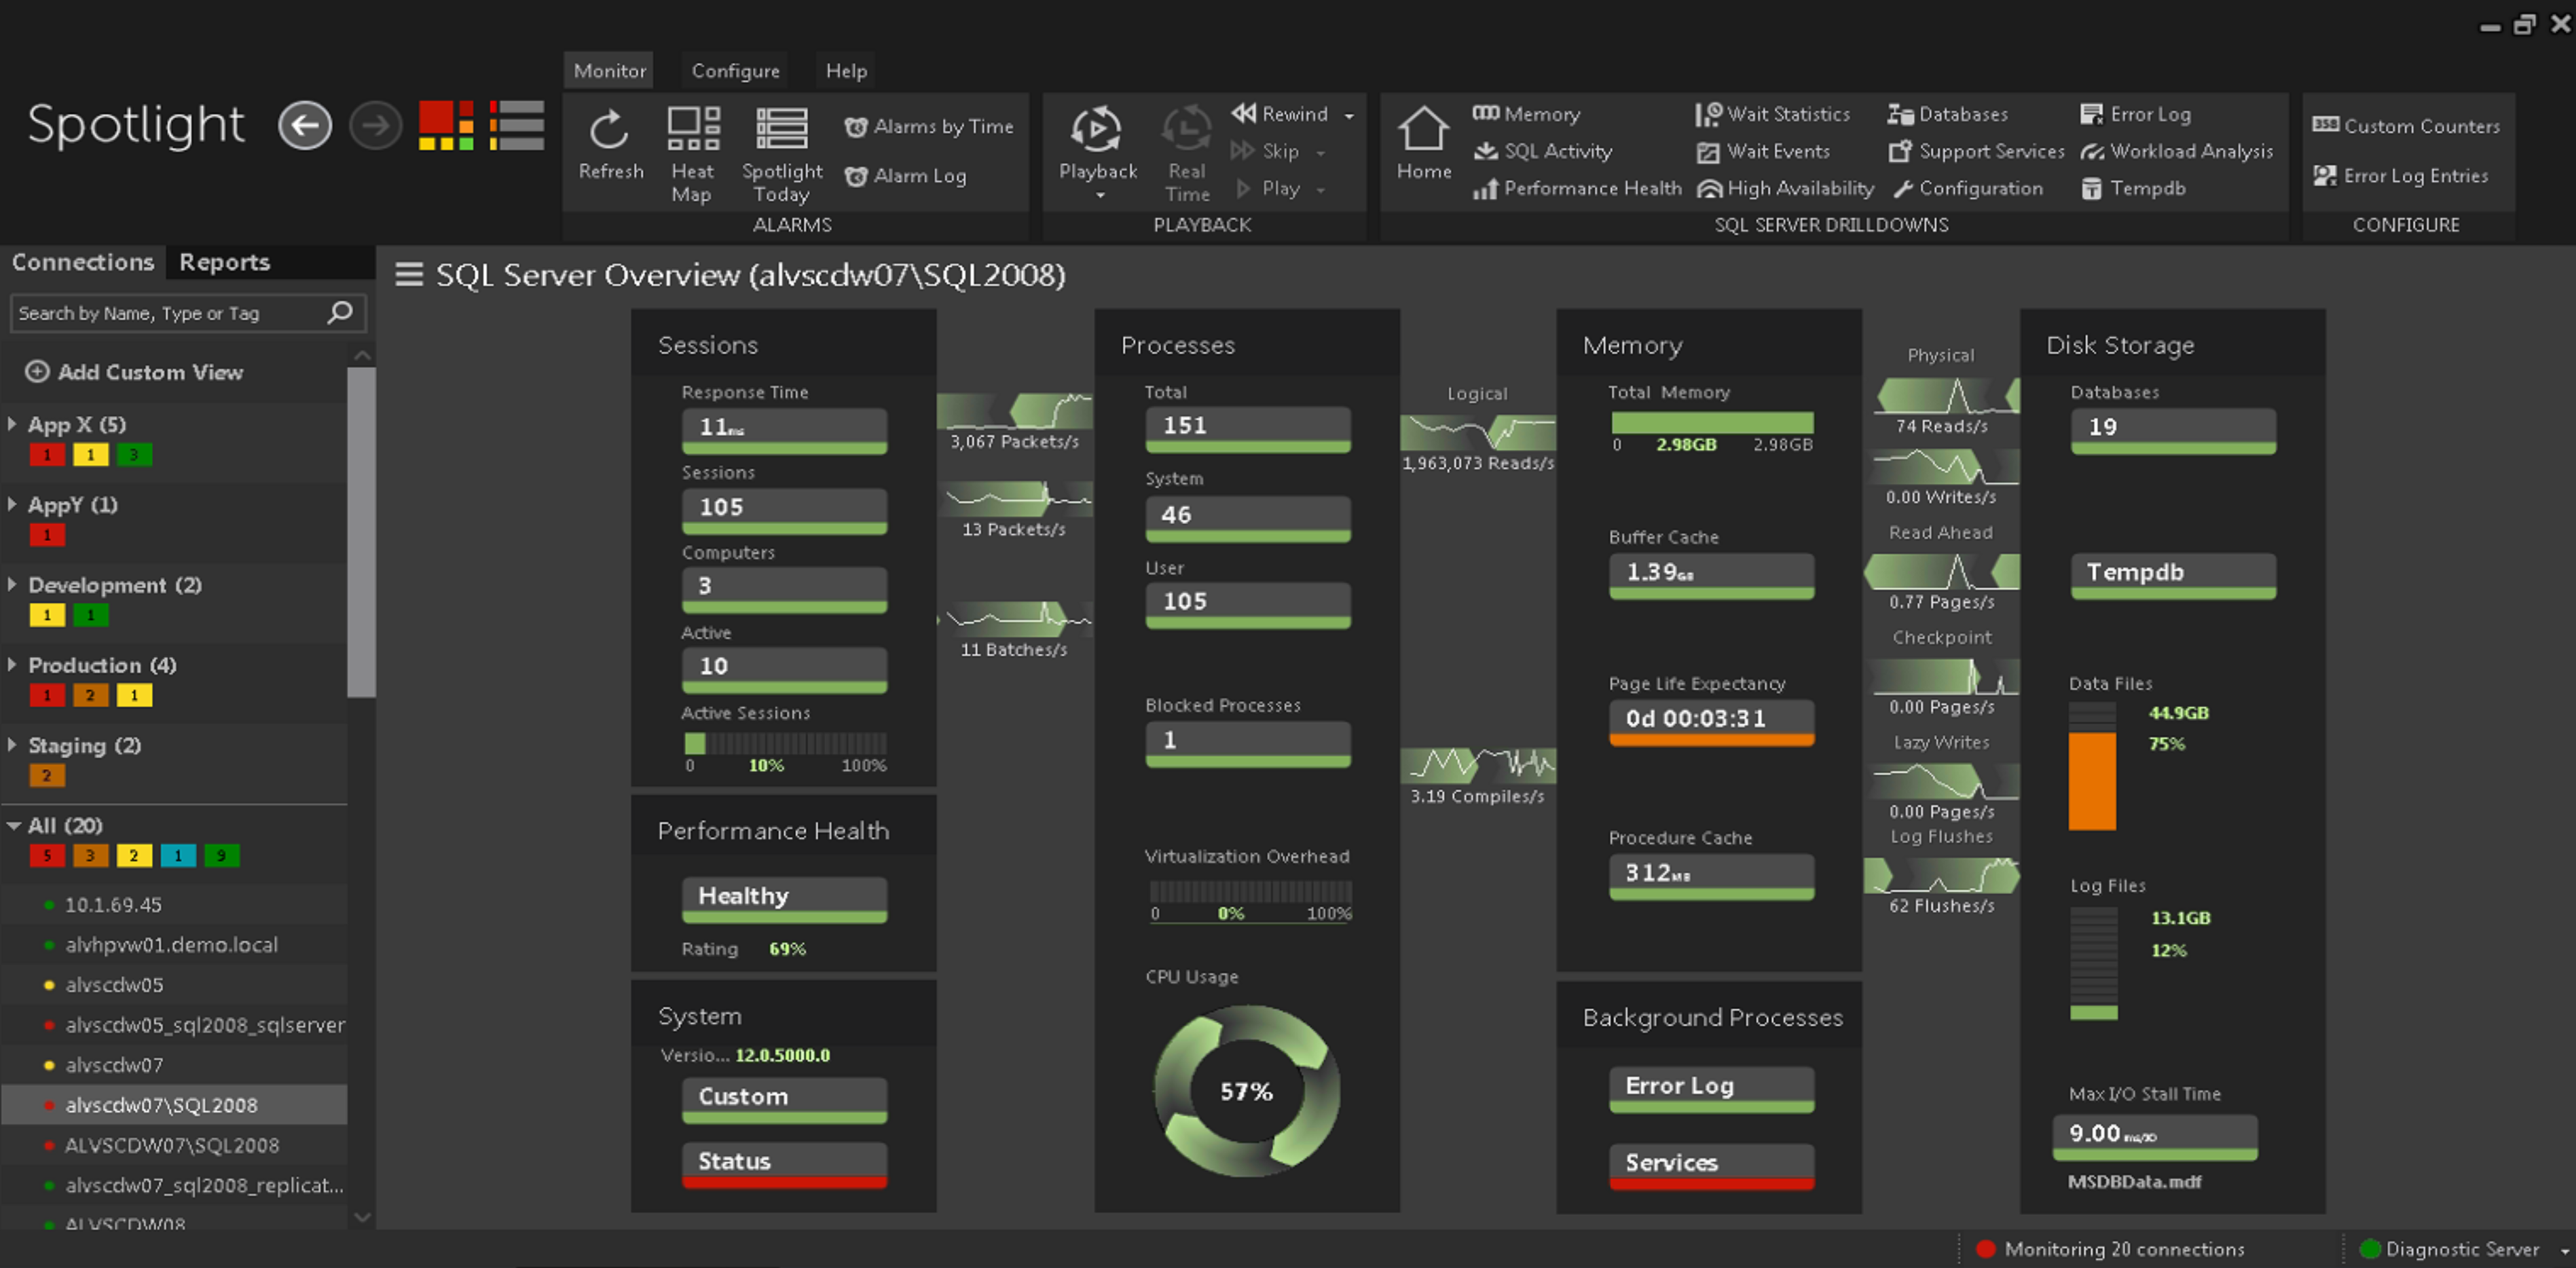
To see Spotlight’s Custom Counter screen, navigate from the Overview dashboard of one of your SQL Server connections to the SQL Activity drilldown as above. The Custom Counters tab shows lists of counters (and their current values) and a graph of their values over time.
To create a counter, click on the Custom Counter Configure button:
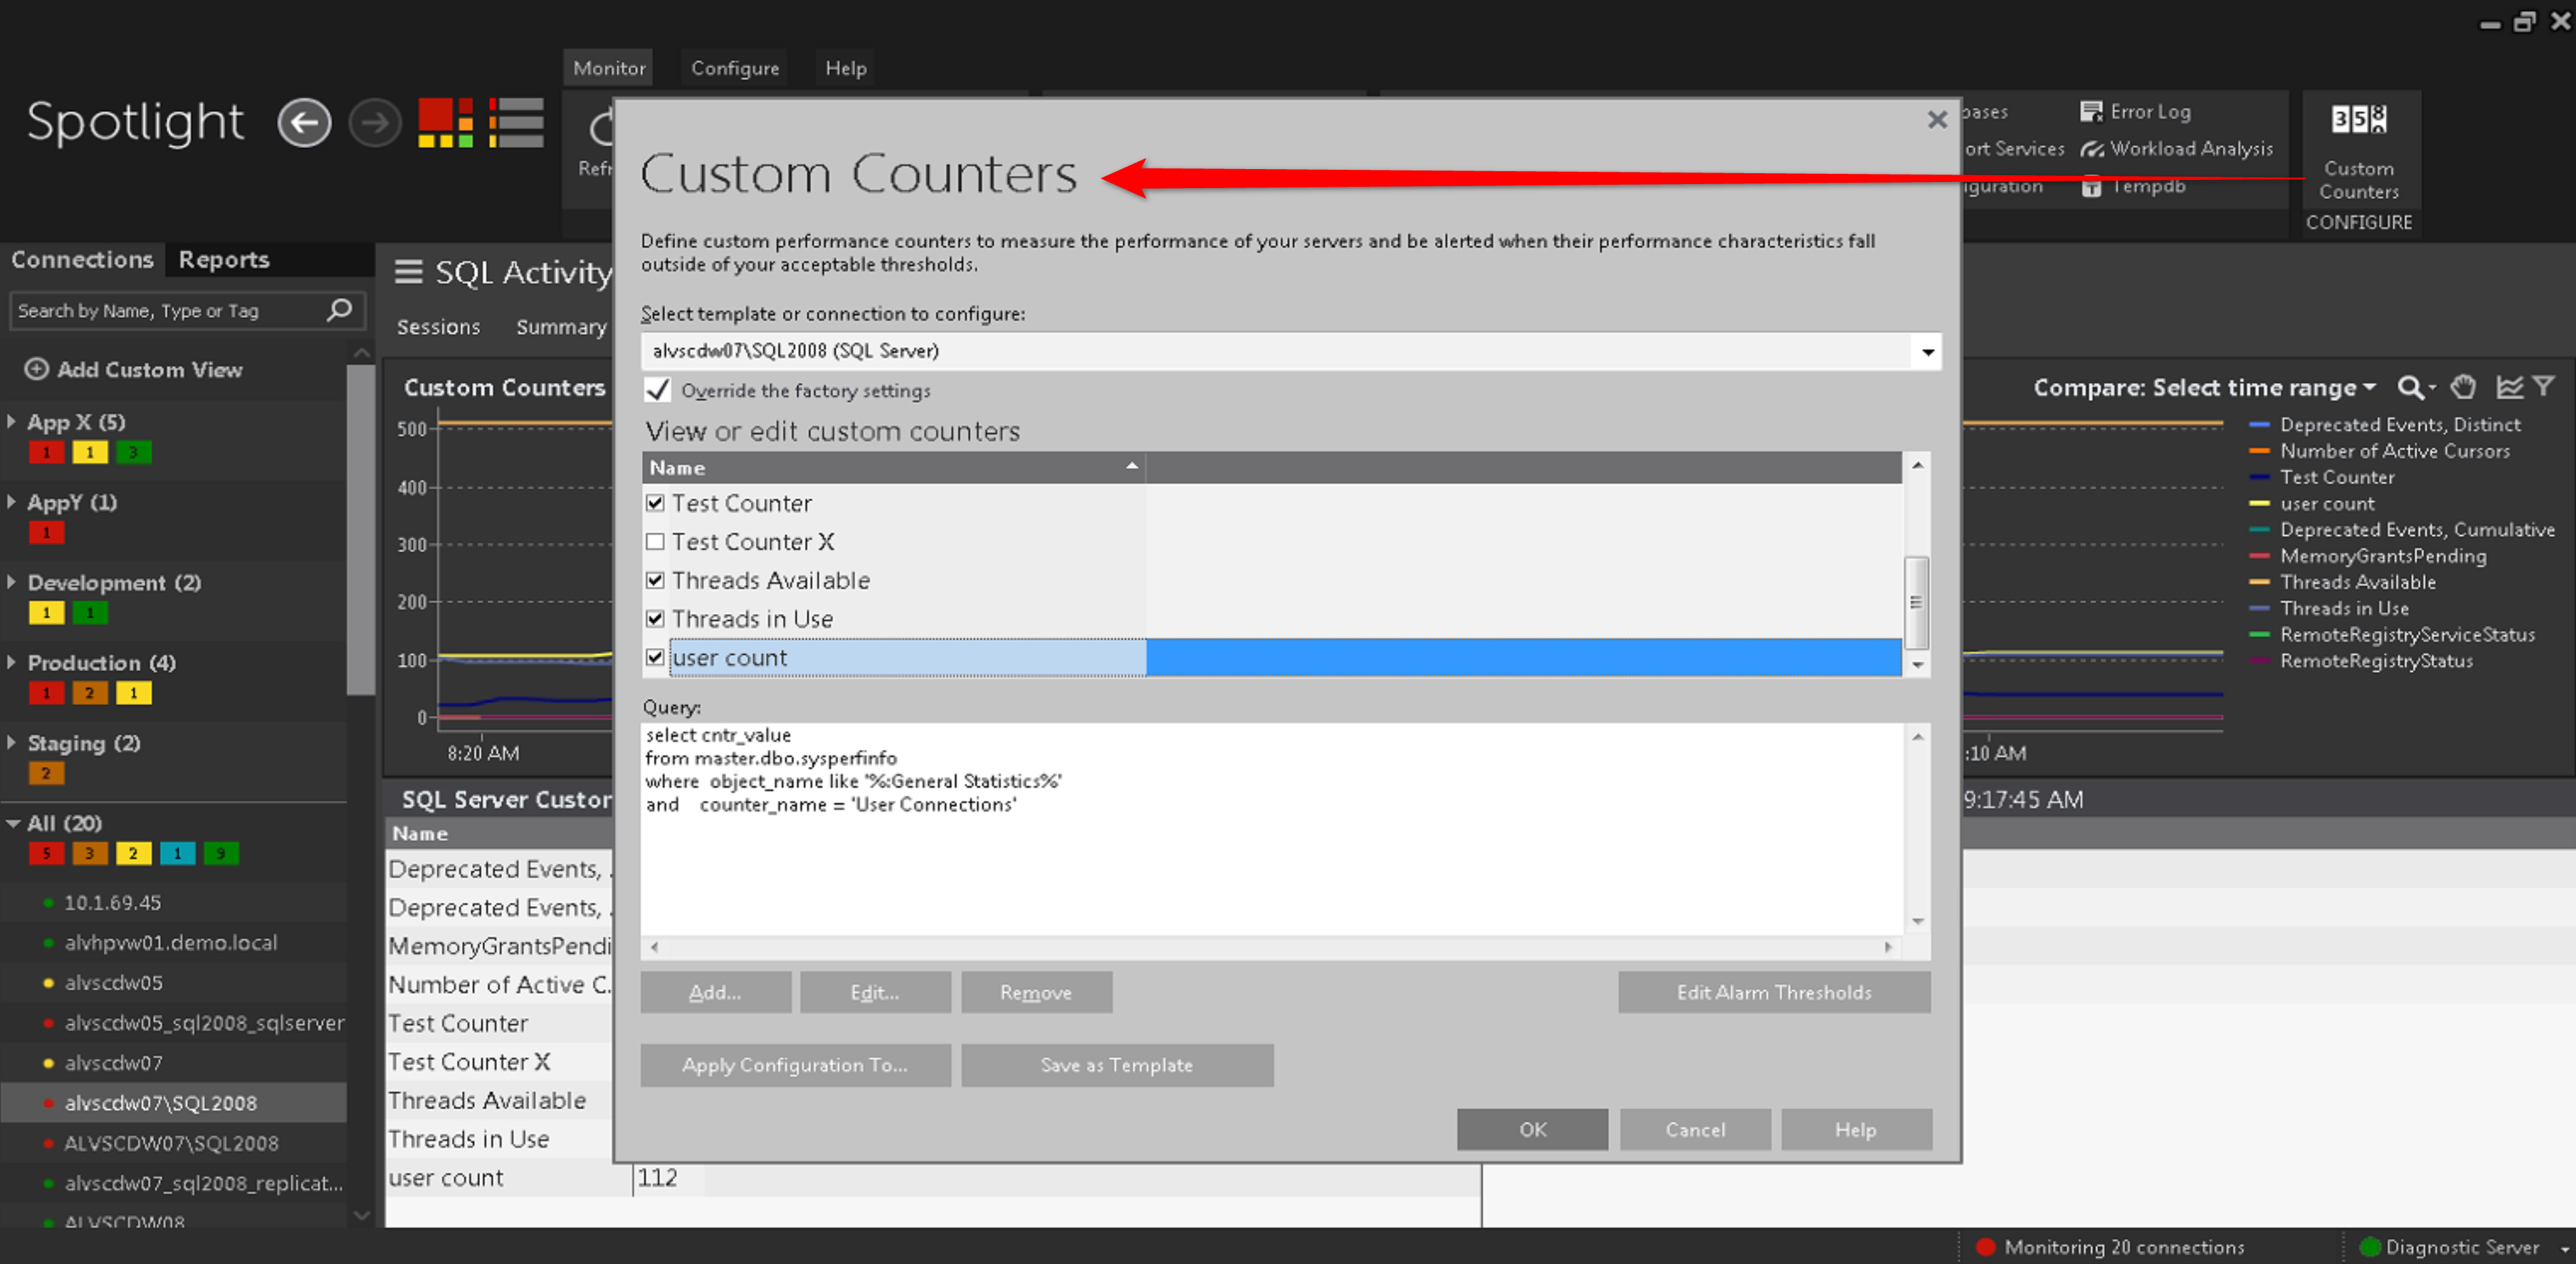
This brings up a box that shows us, at top, the connection that we are creating a custom counter for. (You can also create custom counters for groups of connections using Templates, which are discussed here). Also shown is a list of the current counters with check-boxes to indicate whether they are active, and a Query box below to show the query that gathers the data for the selected counter.
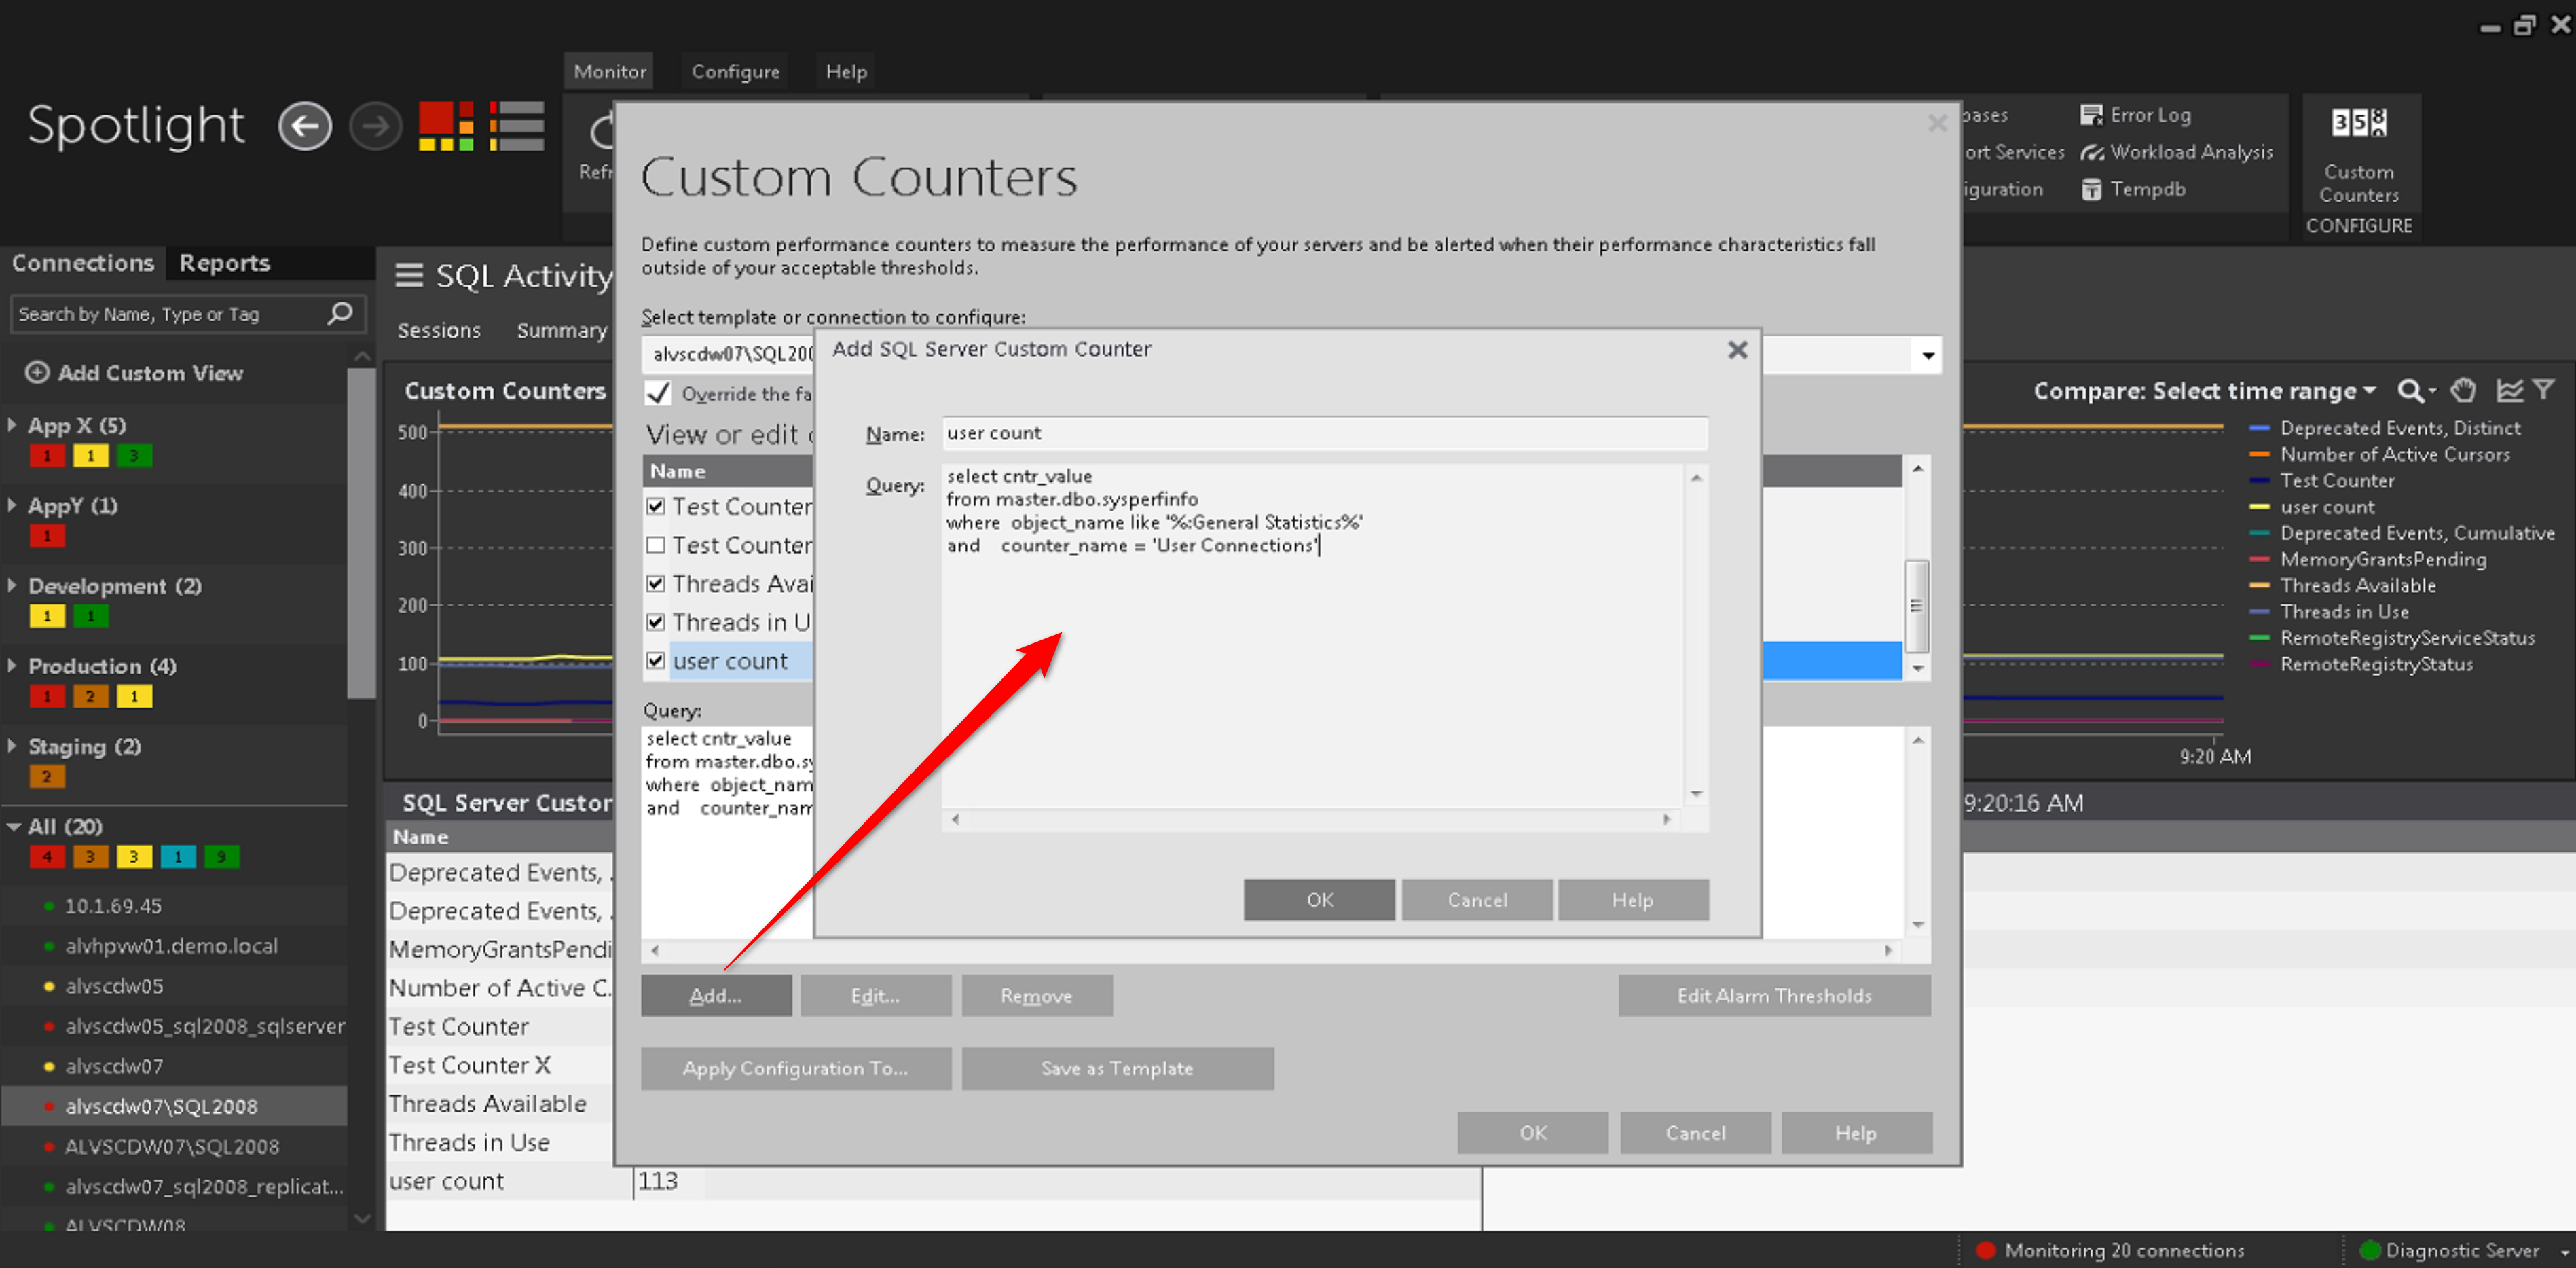
To create a new counter, click Add, and in the box that pops up, supply a name and the query that collects the counter data (this query must return a single numeric value). Then just hit OK (twice) and you’ll see your new counter in a list in the drilldown. As mentioned earlier, the list will show the current value of your counter, and after a little while, a plot of its values over time. You can click on the counter to turn its graph line white for better visibility.
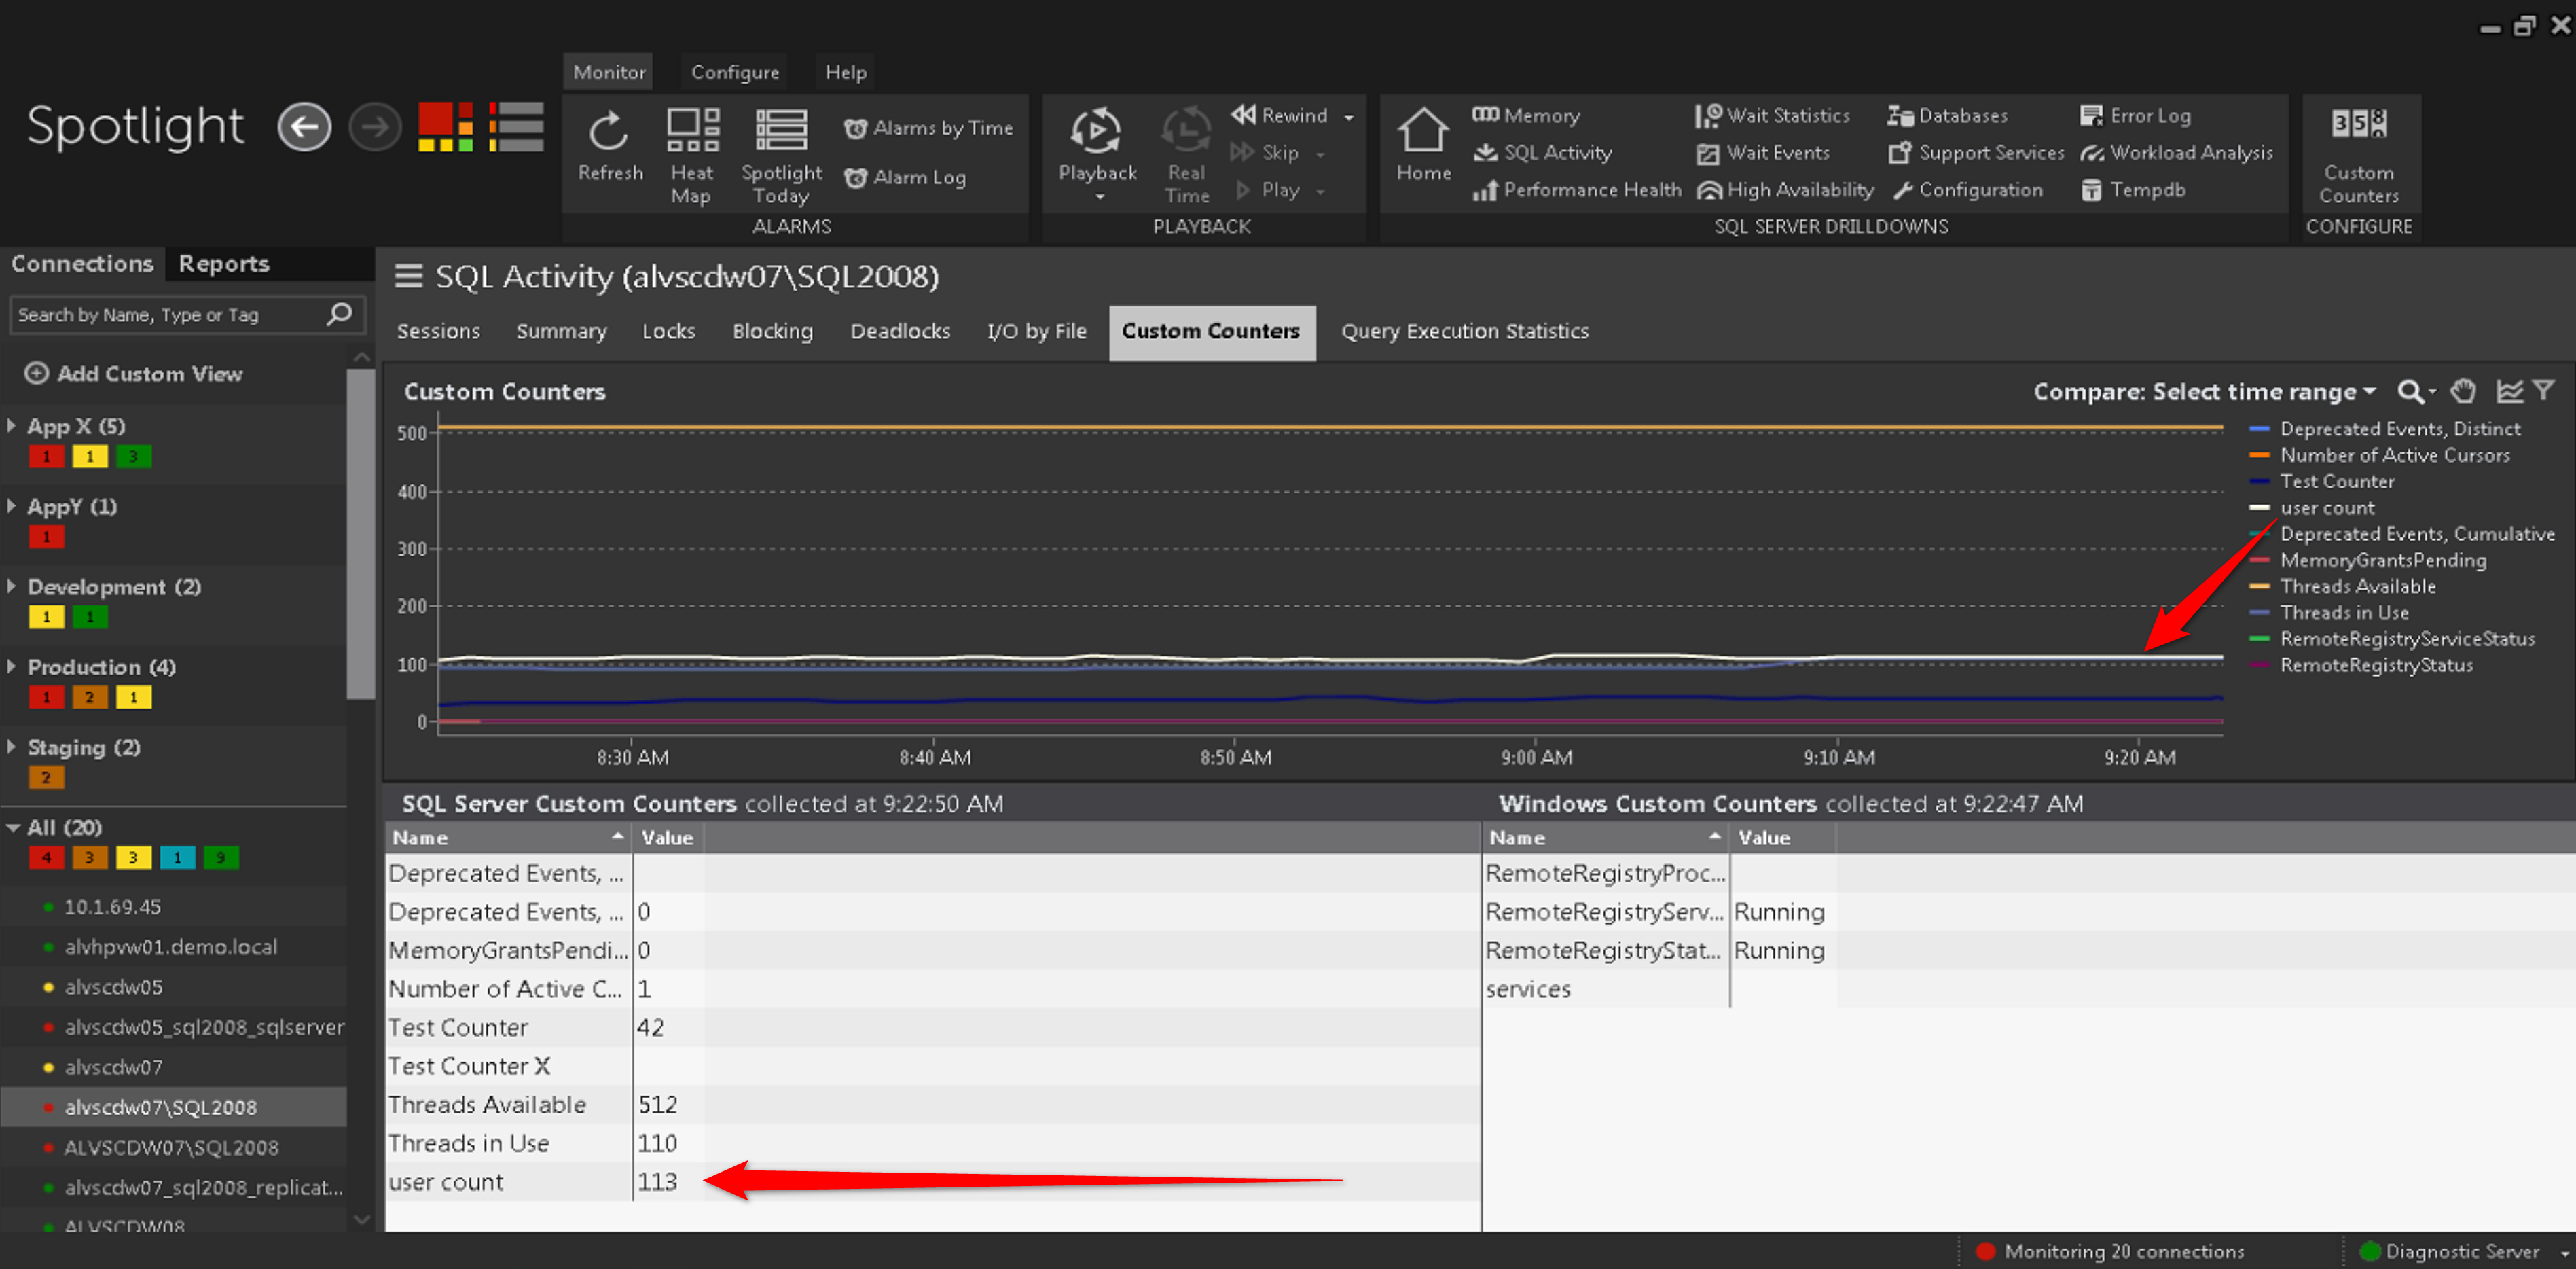
Notice that all of your custom counters have to share a single graph with a single numbered axis along its left edge, so be aware that custom counters with greatly differing scales might not give a great visual presentation. If you’re wondering what the Windows Custom Counters list on the right is all about, those work just the same as the SQL example we’re using here, but use a slightly different query style - just click Help to see some examples.
Now that you know how to see the current and recent values of your custom counters, let’s look at how you can be alerted when the value of one of your counters is outside of the range you’d like it to be in. For this, let’s head to Configure > Alarms:
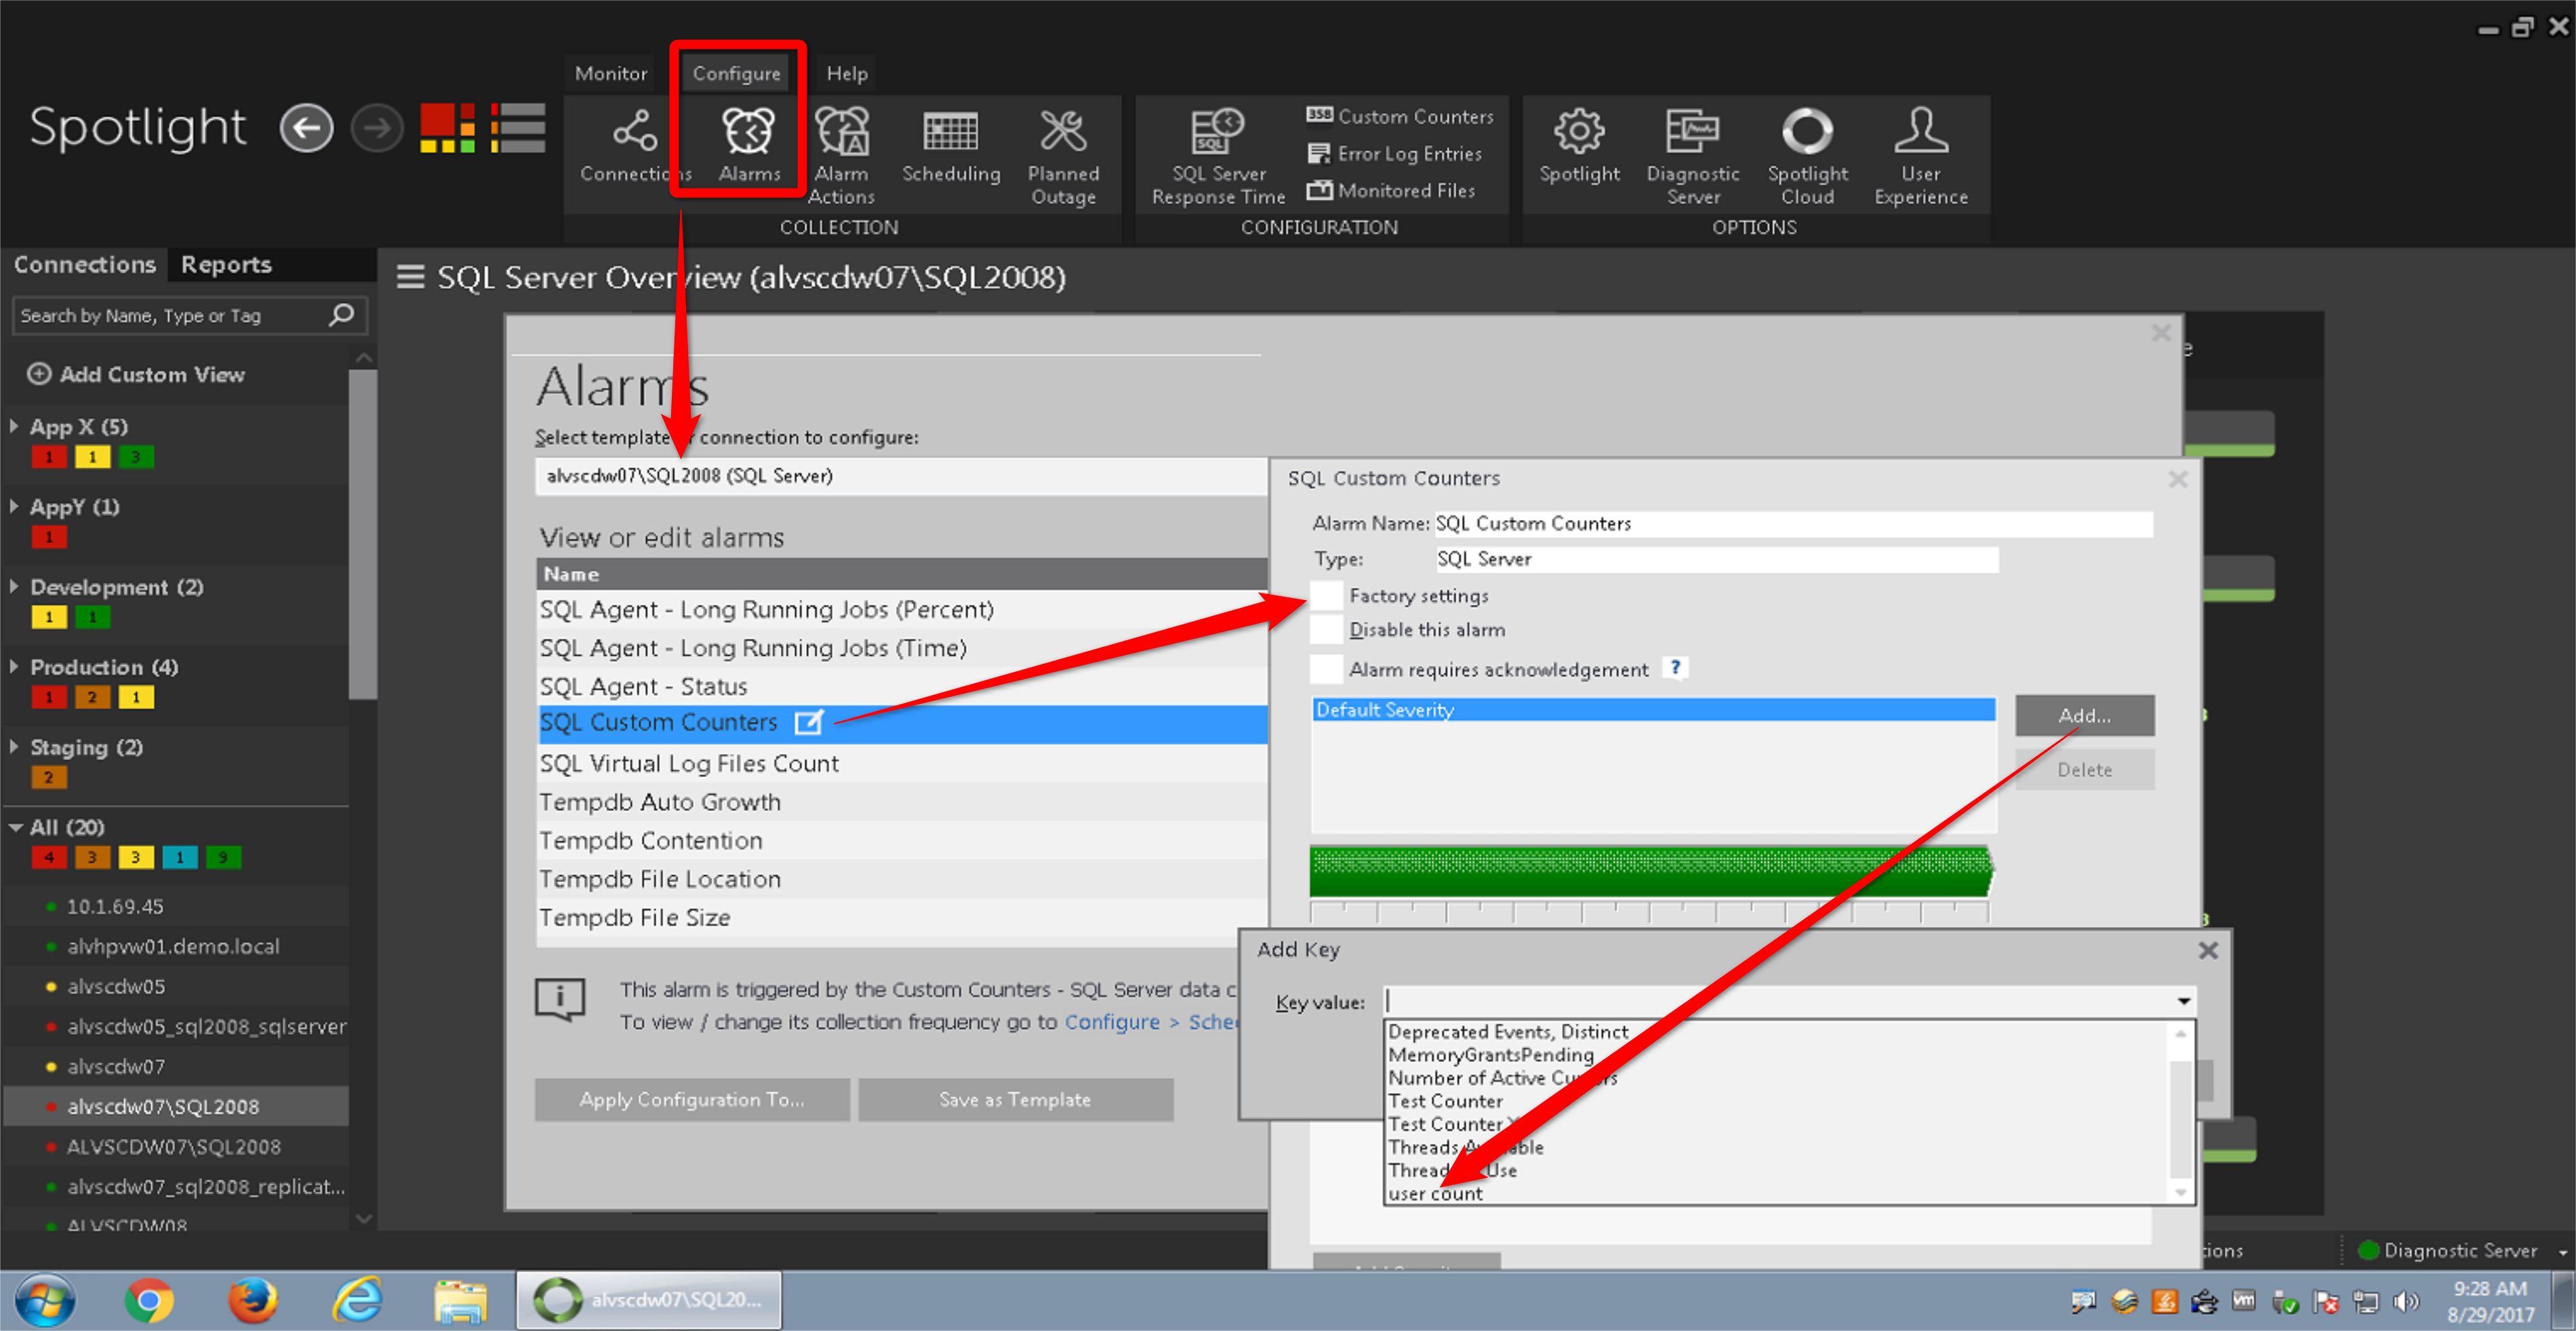
Here again we have a dropdown that lets us specify which connection we are configuring an alarm for. We’ll want to pick the system(s) that we created our custom counter for earlier. Then we’ll need to scroll down to the “SQL Custom Counters” alarm and then follow its link. This brings up a popup where we’ll need to un-check “Factory settings” to enable us to do some customization. By clicking Add, we can find and select the custom counter we created earlier, and then click OK.
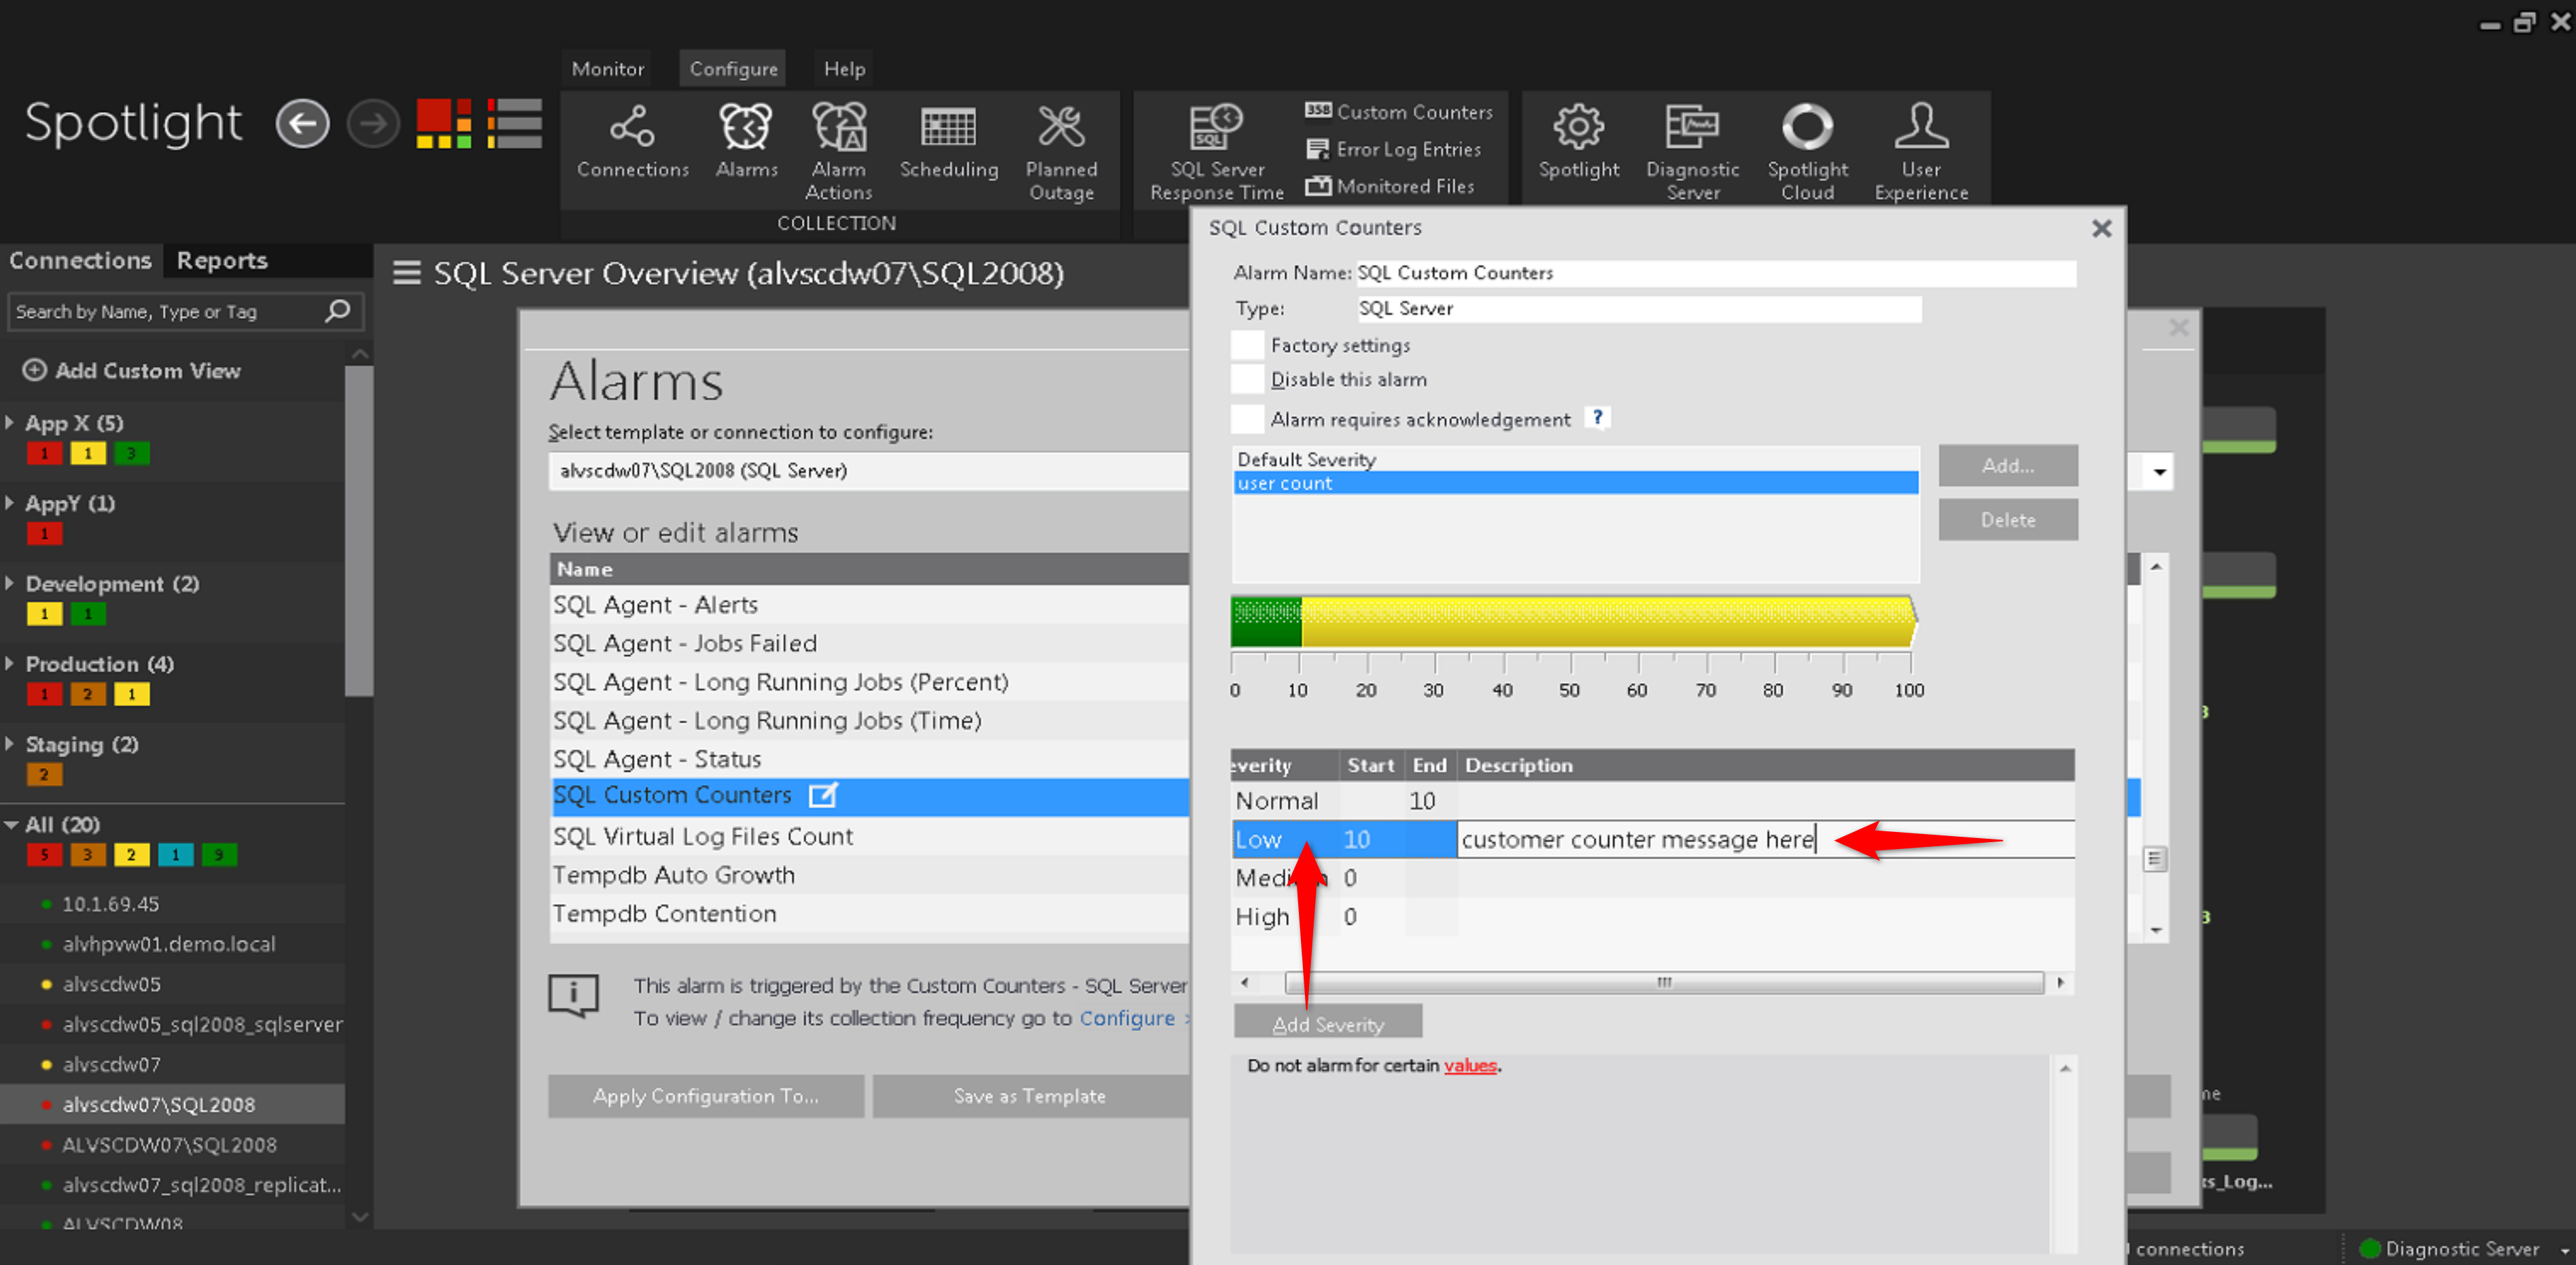
Notice above that a row for our “user count” custom counter has been added below the Default Severity row. Selecting it enables us to click the Add Severity button and then specify the levels we think are normal for this metric and which are Low, Medium and High alarms levels. We’ll need to add the numeric values in the Next column to indicate which value starts each new level. We'll also have to add some text in the Description column – you’ll see why in a moment. We can now click OK twice to exit the setup screens and return to our dashboard.
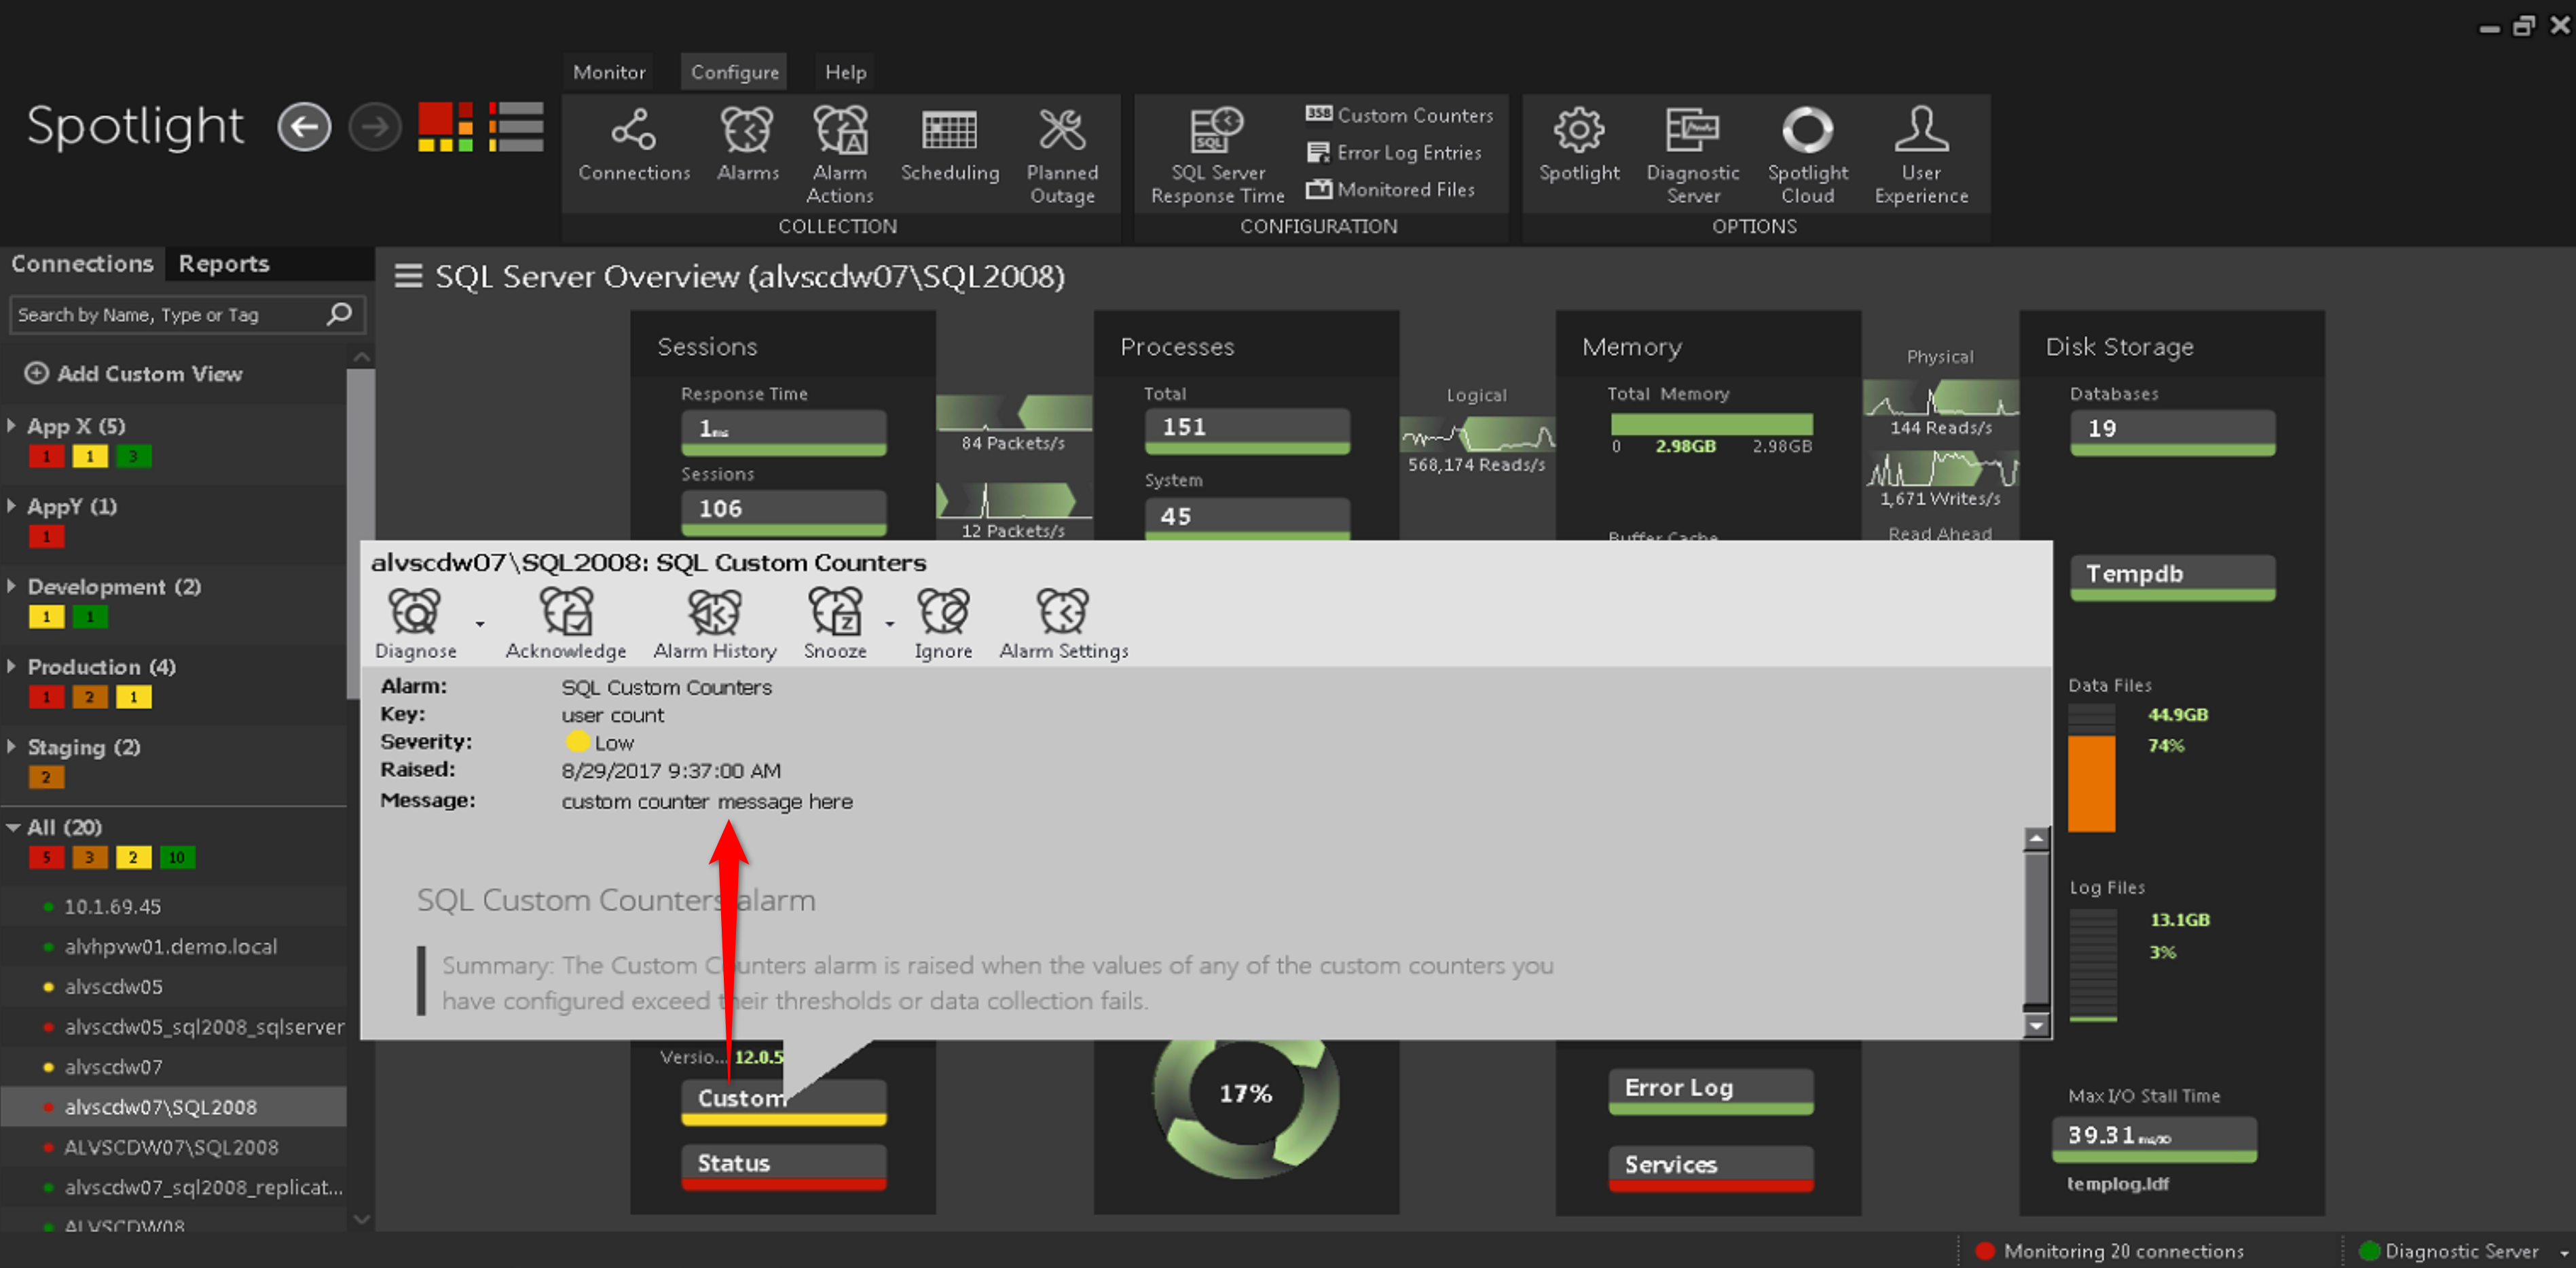
Notice that the Custom button on our dashboard is now indicating that one of our custom counters is in an alarmed state. By clicking on the Custom button we get a popup that shows the alarm severity and time. Most importantly though, we see the Message row, showing the text that we added to the Description column in the last step. So now we know which of our custom counters is alarmed. And by following the Diagnose button we can get to the Custom Counters drilldown:

So now by glancing at a Spotlight dashboard, you can know if one of your custom counters is outside of a desired range. But what if you’d like to be made aware of this by an email alert? No problem – this is set up in Spotlight by choosing Configure > Alarms Actions to bring up the Alarm Action Editor:
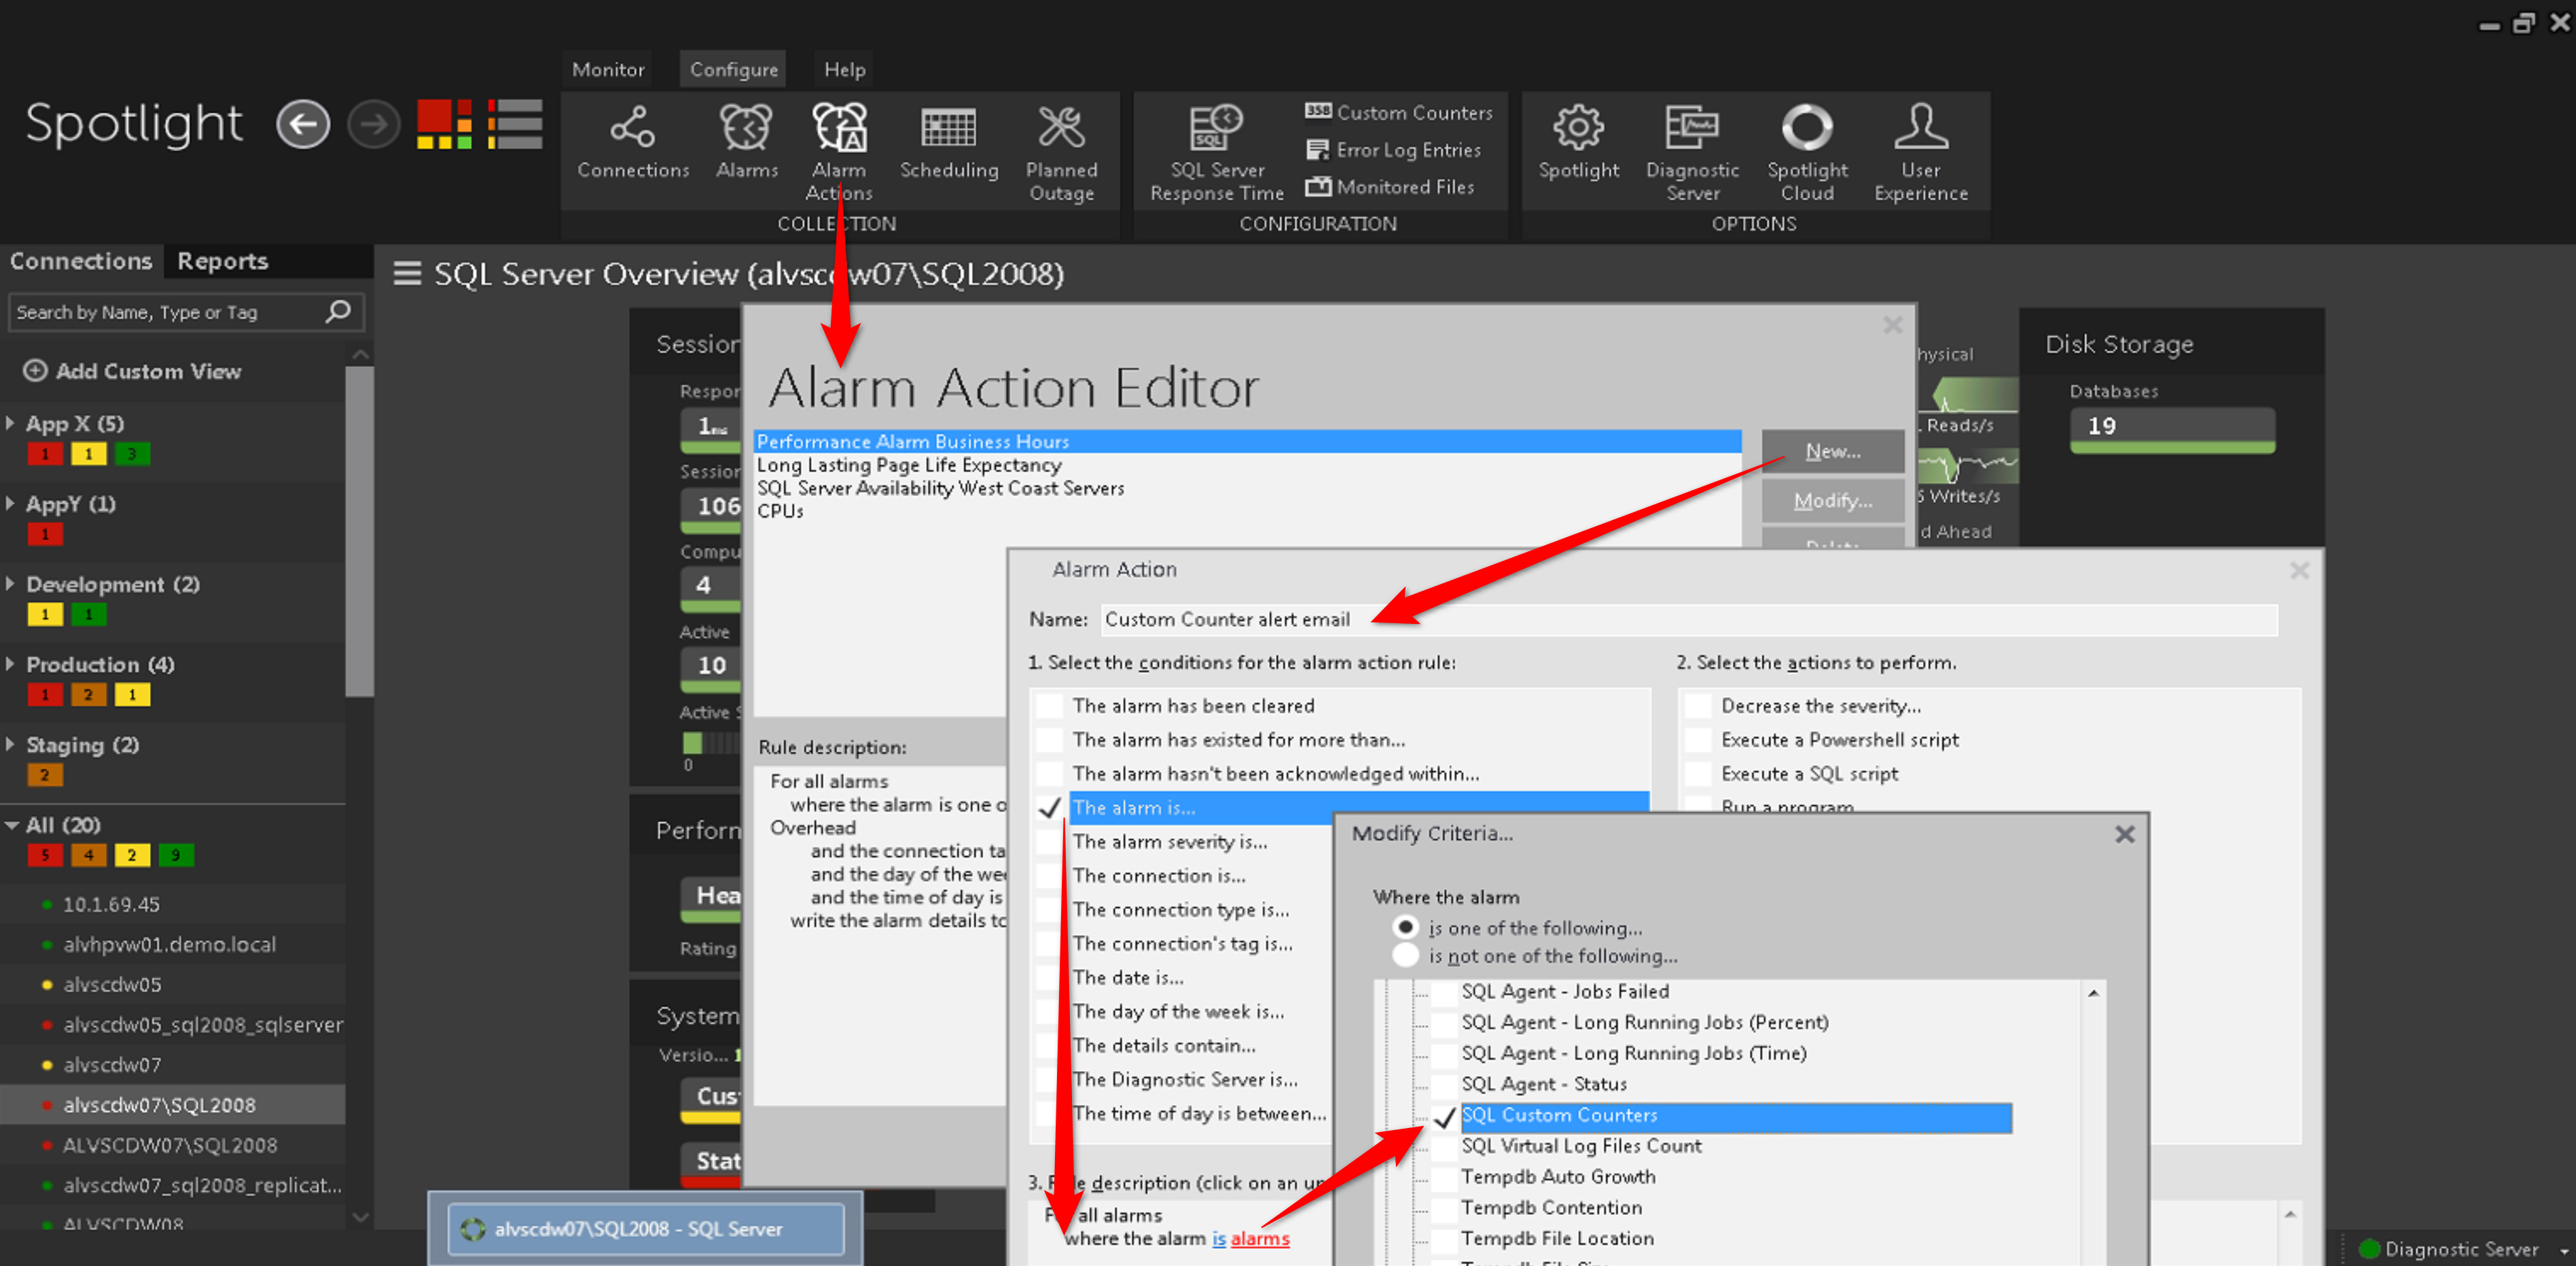
The Alarm Action Editor lets you tell Spotlight to watch for a set of conditions and take one or more actions when they are found. If you're unfamiliar with defining Alarm Actions, I recommend that your read this first.
Note above how to navigate to the SQL Custom Counters alarm. You can’t create a separate alarm action for each custom counter – the action (such as an email going out) will occur when one or more of your custom counters enters an alarmed range. But of course, you’ll know which counter is experiencing an issue from the alarm text mentioned a couple of steps back.
That's it! Did you think all of those old custom scripts that you used to monitor your SQL Server with were useless? No way - put 'em in Spotlight!
All of my Quest Database Performance blog posts can be found here.
