
Spotlight on SQL Server provides excellent real-time monitoring, workload analytics and more for SQL Server. You can download the complete software for a 30-day trail on as many systems as you'd like. A previous post walked through the installation of Spotlight, but once that's done, it's necessary to point Spotlight at the systems you’d like it to watch. Luckily, that’s as simple as going to Configure > Connections to get to the Connection Manager:
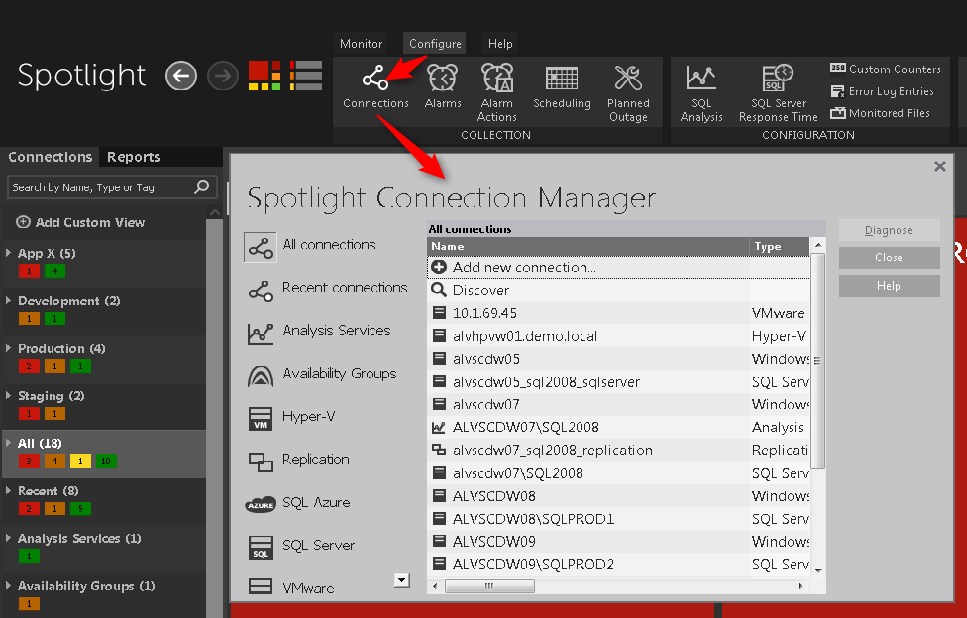
As you can see in the screenshot above, Spotlight can connect to a number of different types of systems. In this post, we’ll focus on connecting to SQL Server, Windows and VMware, since those are the types that get the most day-to-day usage.
Setting up monitoring for single server
For large environments, Spotlight has a method to register many servers in single pass through a wizard. But we’ll cover that later. For now, let’s step through setting up a single server for monitoring. In the Connection Manager, choose “SQL Server” from the list on the left, then click “Add new connection”:
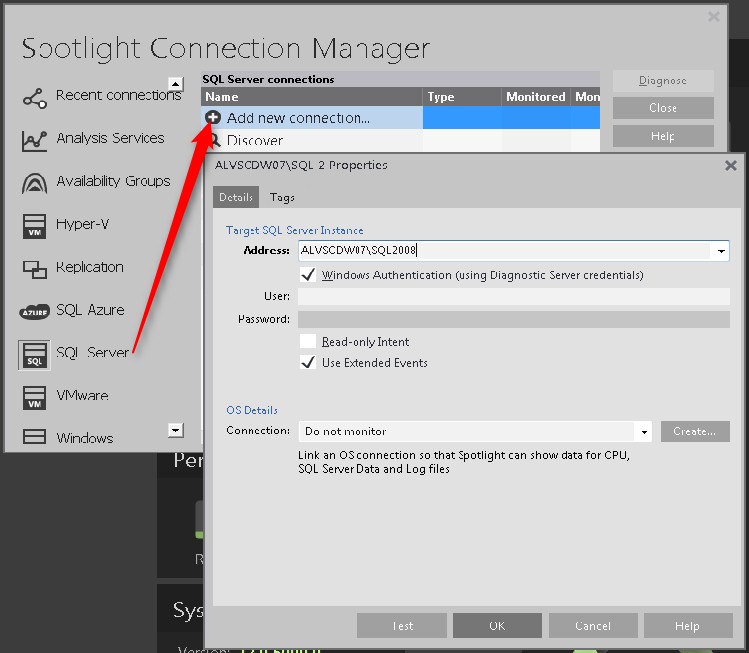
This brings up a box where you enter the name of the SQL Server instance you’d like to monitor, and supply the credentials that Spotlight will use to connect to it.
Typically an account with SQL Administrator level permissions is used, but lesser permissions can be used, and scripts to give these permissions to the account you are using are provided in the Spotlight on SQL Server Deployment Guide.
If the Spotlight Diagnostic Server service is running under an account with the necessary permissions, you can just check the box that says “Windows Authentication (using Diagnostic Server credentials)” and that same account will be used to collect metrics from the server we’re registering. If not, you’ll need to enter a SQL Server Authenticated login and password in the boxes below the checkbox.
And by the way - remember that Spotlight has context-sensitive help from each of the boxes we'll see, so don't forget to click Help for more info!
Adding Windows monitoring
At this point, you’ve given Spotlight what it needs to monitor SQL Server, and if that’s all you wanted, you could just hit OK. But you probably want to monitor the Windows host that your SQL Server resides on, so hit the Create button:
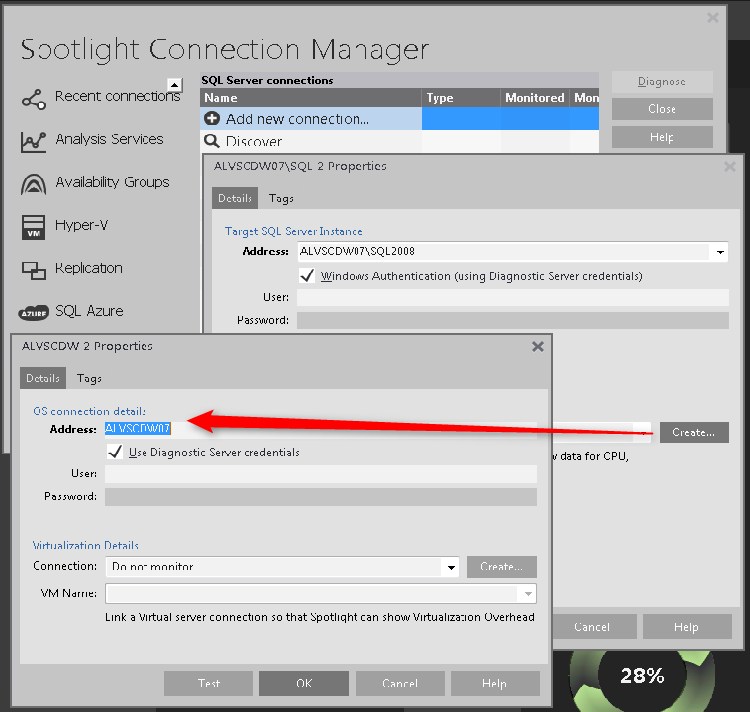
This brings up a box where you enter the name of the Windows machine hosting the SQL Server we just registered (actually, it will probably already be populated for you). For Spotlight to monitor Windows, the account it is using here to connect needs to be in the Window Local Administrators group on the monitored machine.
Again, if the Spotlight Diagnostic Server service is running under an account with the necessary permissions, you can just check the box that says “Windows Authentication (using Diagnostic Server credentials)”. If not, you’ll need to enter a Windows account with the necessary permissions.
Now you’ve given Spotlight what it needs to monitor Windows, but before you click OK, notice that there is Virtualization Details area of the box with yet another Create button next to it.
Adding VMware or Hyper-V monitoring
Clicking the Create button next to the Virtualization Details area of the box asks you to choose between and VMware and Hyper-V, and then brings up a third box:
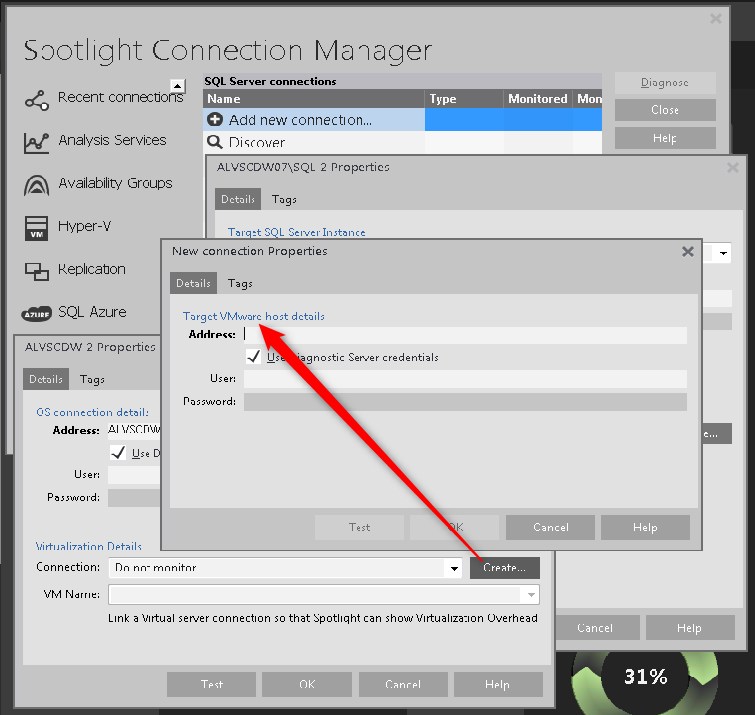
Here you enter the IP address or hostname of the ESX, VirtualCenter or Hyper-V server hosting the Windows environment you just registered. You’ll also need to supply authentication for Spotlight to use to connect to the virtualization server. The account must have at least a read-only role for the ESX, VirtualCenter or Hyper-V host server. Once that’s done, you can hit OK in this box (and on the prior two boxes) and close the Connection Manager to see what we’ve accomplished.
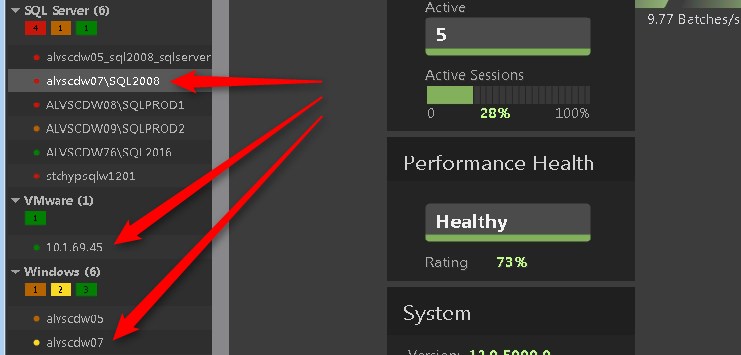
View the connections you’ve added
In a single pass through this Connection Manager workflow, you’ve created connections to a SQL Server instance, its Windows host, and when applicable, the virtualization system that it resides on. You can confirm that this succeeded by clicking on each connection in the left panel:
Manually associating connections
You do have the option of creating each connection type separately rather than all at once as we did above, but if you do, you’ll need to associate connections of different types with each other. This is because some dashboards get their information from multiple connection types. For example, CPU appears on both the Windows and SQL Server dashboards:
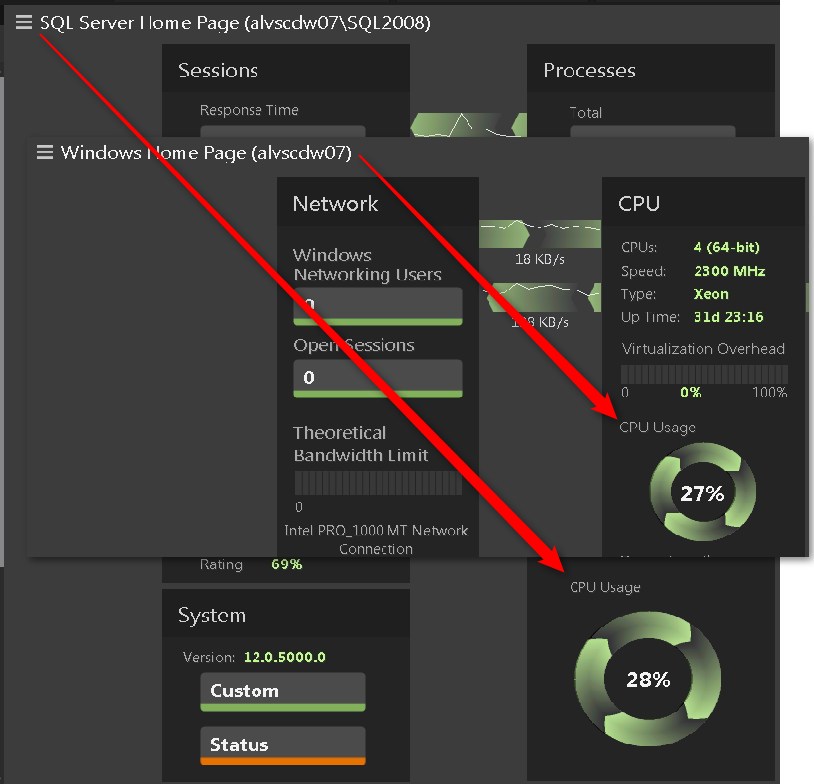
CPU is a Windows metric, so the SQL Server dashboard gets the percentage CPU value from the Spotlight Windows connection. By right-clicking the SQL Server connection and choosing Properties, you can see the Windows connection that the SQL Server connection is getting its CPU information from:
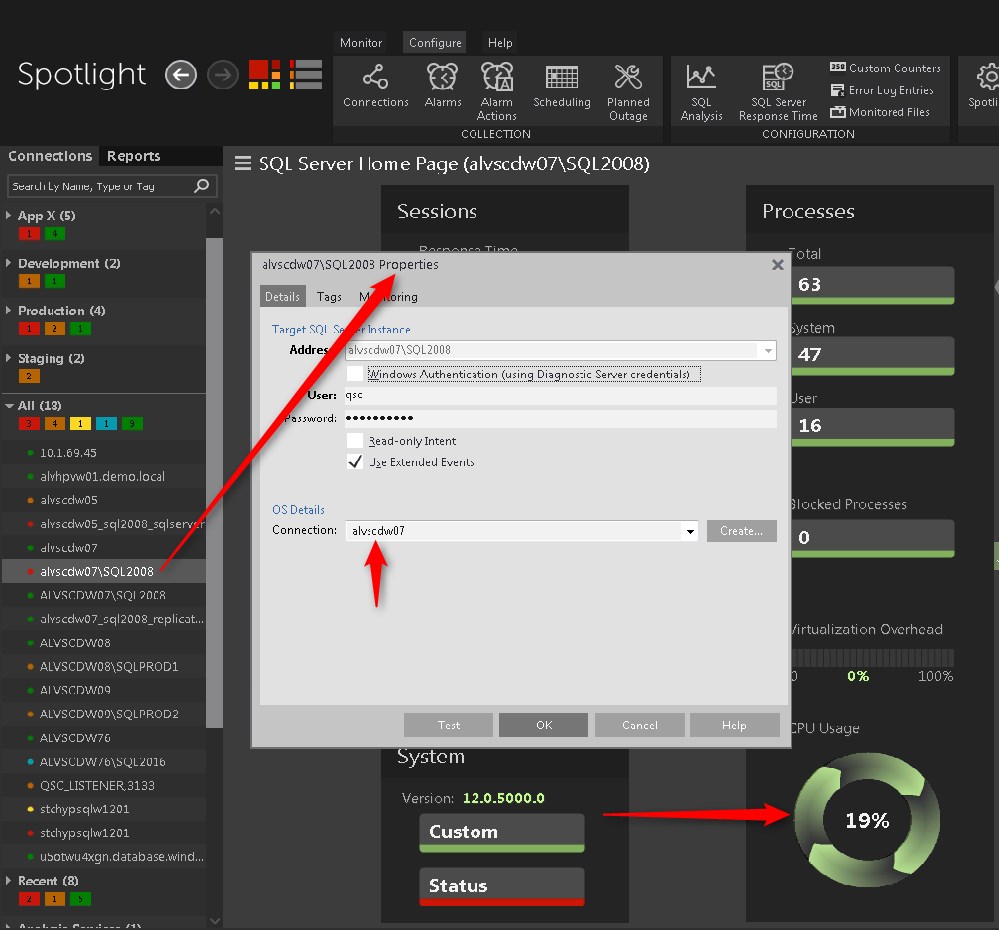
Similarly, the Virtualization Overhead metric that appears on the SQL Server dashboard comes from the VMware/Hyper-V connection. To get that information to propagate up to the SQL Server dashboard, open the Properties of the related Windows connection and indicate for Virtualization Details the name or IP address of the virtualization environment that the OS resides on. If the Windows connection is associated with a SQL Server connection as in the above screen shot, it will in turn feed the Virtualization Overhead metric up to the SQL Server connection for display as the Virtualization Overhead metric on the SQL Server dashboard.
Now that you've monitoring of at least system configured, check out how to use Spotlight here.
Registering lots of SQL Servers for Spotlight monitoring all at once
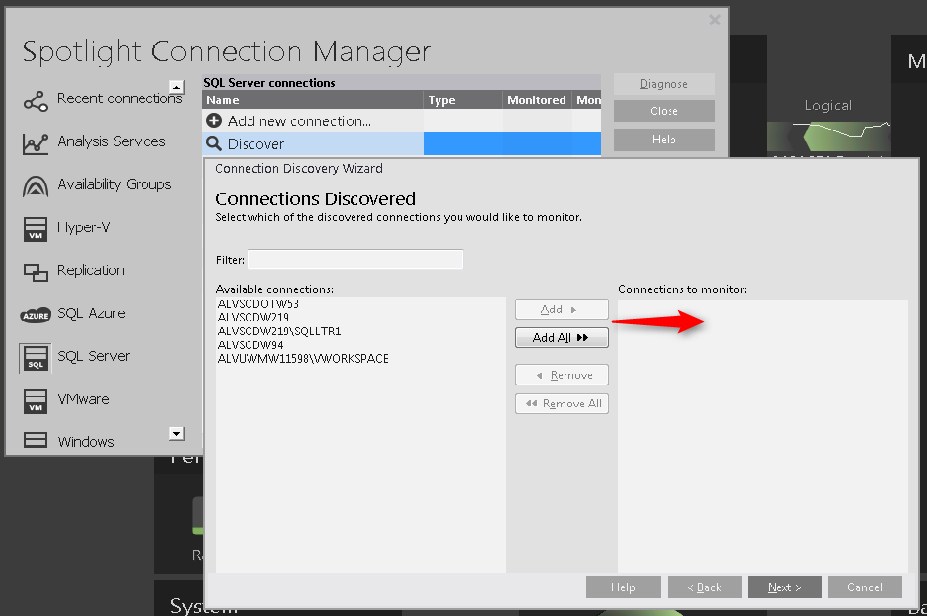
If you’re looking to use Spotlight on many SQL Servers, you probably won’t want to register those systems for monitoring one-by-one. This is where Connection Discovery Wizard comes in handy. Choosing “Discover” from the Connection Manager gives you a couple of options:
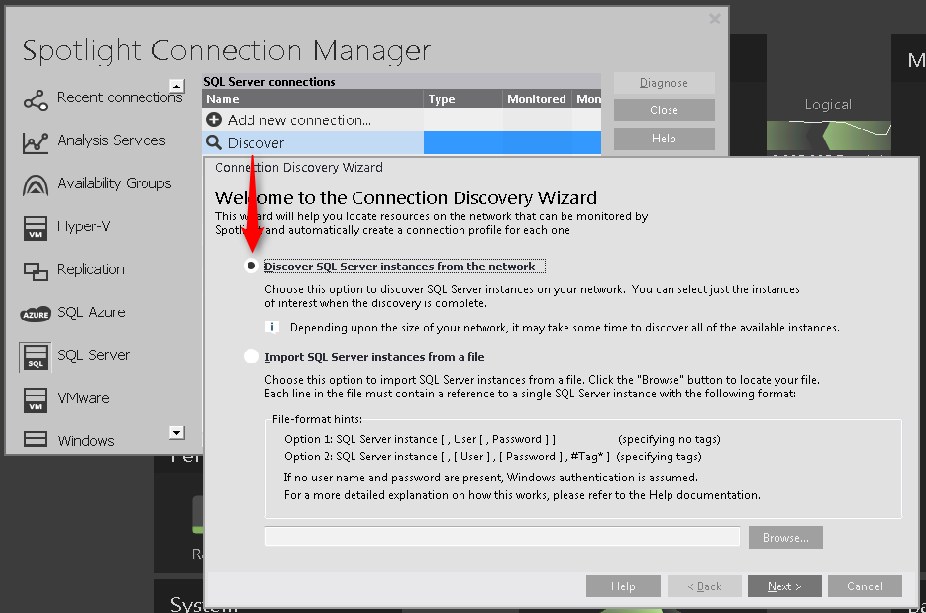
The first option will scan your network for the presence of SQL Servers, and then present you with a list of what’s been found (remember that the Browser Service on each SQL Server will need to be on, and the instances will need to not be hidden to be discoverable). You can choose Add All or select the SQL Servers you’d like to monitor and then choose Add to set up monitoring:
Choosing “Next” will then give you a chance to edit the credentials that Spotlight will use to connect to each instance (and host OS):
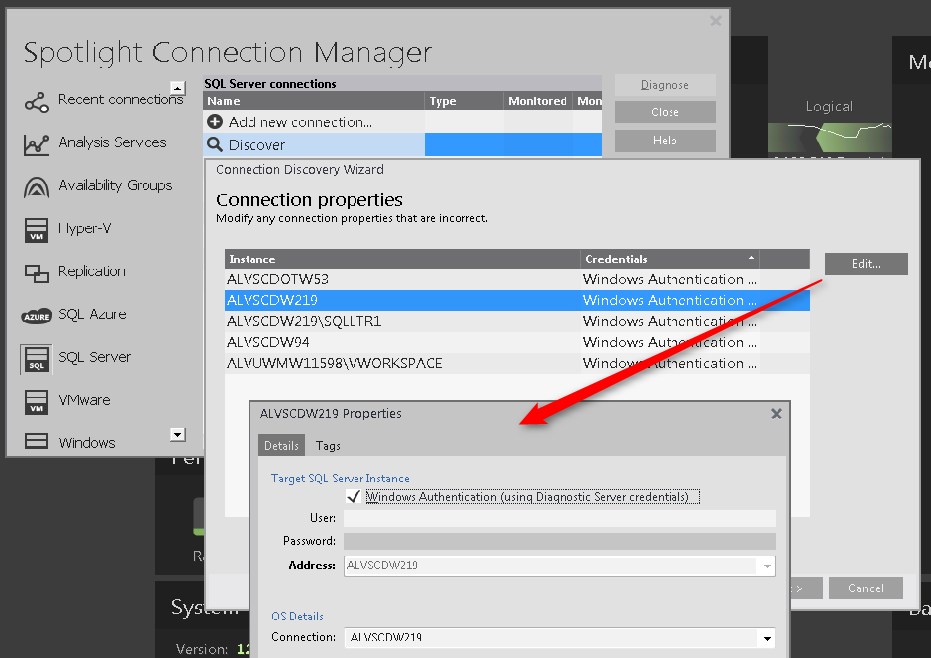
Spotlight defaults to using the credentials that the Spotlight Diagnostic Server service is running under, and using this option when the service has the necessary credentials is recommended when possible, because it will mean that you won't need to enter credentials for each connection.
The rest of the wizard is fairly self-explanatory, so let’s move on to the final method for pointing Spotlight at lots of servers all at once: the Discover > “Import SQL Server instances from a file” method:
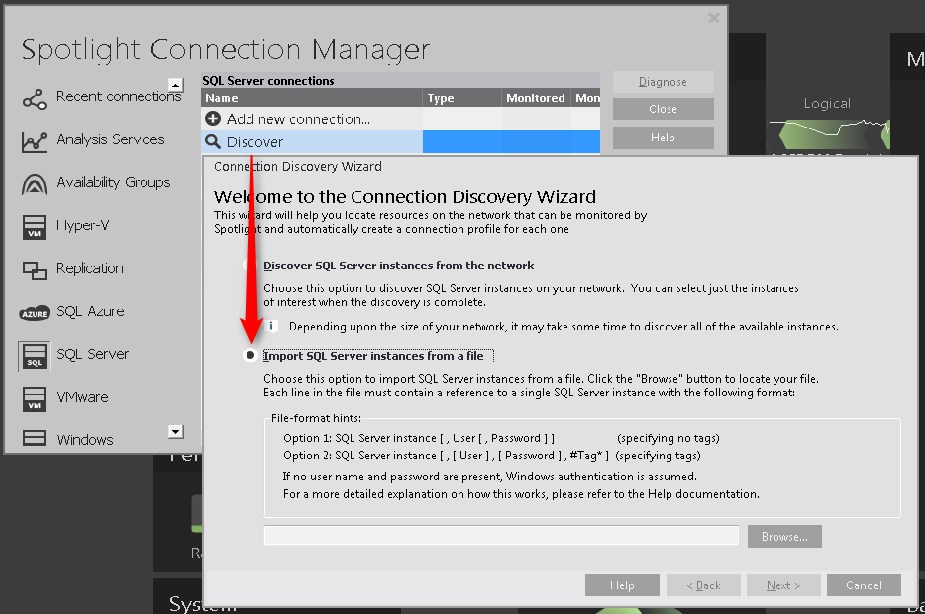
From here you choose Browse to navigate to a file that contains the list of servers you’d like to connect Spotlight to. Clicking “Help” in this box will take you directly to a page that details the required information and formatting for this file.
Happy Monitoring!
All of my Quest Database Performance blog posts can be found here.
