This discussion has been locked.
You can no longer post new replies to this discussion. If you have a question you can start a new discussion

Query Execution Statistics

Hi.  I have a question about Query Execution Statistics in Spotlight on SQL Server Enterprise, version 12.1.0.   What I am wondering about is how far back does the "last 50" statistics go?  That is, is it four hours, 24 hours. or forever?  I don't really believe it is more than 24 hours because the "Last Execution Time" is usually from last night when batch was run.  So another part of the question is whether I can influence the time interval for the report.

Thanks.  

Jim

Parents
  • Hi Gita … thank you for responding. 

    You mentioned that the drilldown cannot be configured by time interval.  What I was wondering was, can we determine what time interval Spotlight is using?  That is, it seems to me the interval is somewhere between 4-8 hours.  The reason I ask is if I want to check out a “problem child” SQL statement that has already finished, but if I am past the time interval, it won’t show up (even if it consumes massive amount of CPU time).  For instance, if someone yesterday tells me that the "database was running slow", and I know there is volatility in a particular SQL statement, I probably won’t see that statement on Query Execution Statistics because the time interval is past.  About the only thing I can do under that situation is to use the Playback feature and hope that I can catch the SQL that way.

     Regards,

    Jim

  • Hi Jim,

    Just a bit of background on this drilldown. The Query Execution Stat drilldown fetches data from sys.dm_exec_query_stats. So, Spotlight relies mainly on what this DVM returns which isn't time based. The description of this DMV per Microsoft:

    “Returns aggregate performance statistics for cached query plans in SQL Server. The view contains one row per query statement within the cached plan, and the lifetime of the rows are tied to the plan itself. When a plan is removed from the cache, the corresponding rows are eliminated from this view.”

    You can find more details on it here:
    https://docs.microsoft.com/en-us/sql/relational-databases/system-dynamic-management-views/sys-dm-exec-query-stats-transact-sql?view=sql-server-2017

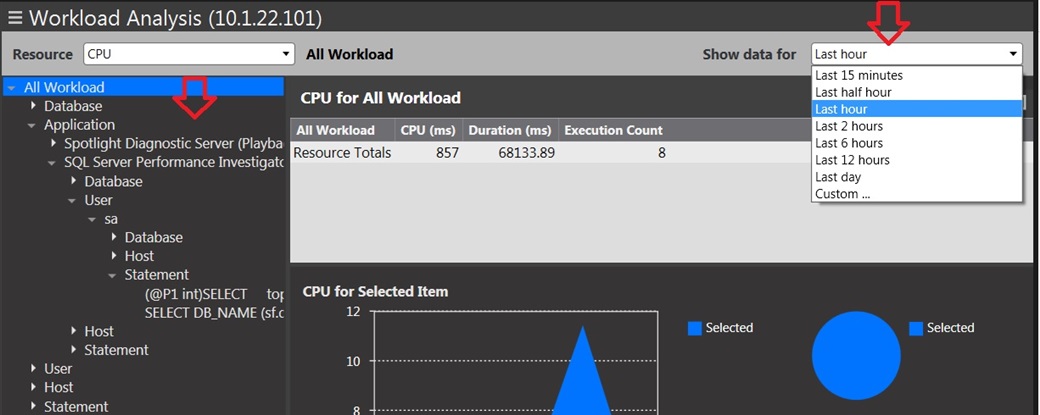
    .Aside from using the Playback mode in this drilldown, you can also try the Workload Analysis drilldown. It's more powerful to diagnose such issues, as it displays problem areas in various dimensions and a time frame can be selected, along with the Playback mode.

  • Gita, thank you for the explanation!  I really appreciate it.  I am fascinated about this topic and did a little more research on how a plan gets aged, or "reaches zero".  If memory isn't under pressure on the server, it is a function of the plans re-use and whether it is ad hoc or prepared.  I found a pretty good write up in Stack Exchange here:  https://dba.stackexchange.com/questions/151140/can-a-plan-age-reach-zero  

    I wish I could better know the time interval but at least I understand that there is considerable complexity to it.  

    Please considered this question answered (and answered very well).  Thanks again.  Jim

Reply
  • Gita, thank you for the explanation!  I really appreciate it.  I am fascinated about this topic and did a little more research on how a plan gets aged, or "reaches zero".  If memory isn't under pressure on the server, it is a function of the plans re-use and whether it is ad hoc or prepared.  I found a pretty good write up in Stack Exchange here:  https://dba.stackexchange.com/questions/151140/can-a-plan-age-reach-zero  

    I wish I could better know the time interval but at least I understand that there is considerable complexity to it.  

    Please considered this question answered (and answered very well).  Thanks again.  Jim

Children
No Data