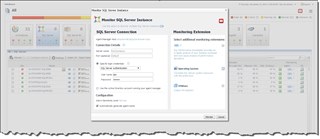
When you first monitor a database instance, you have the option of adding the host too. But sometimes, the checkbox is un-checked. Now what?
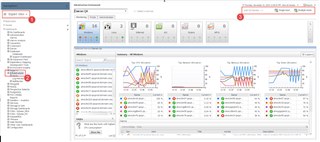
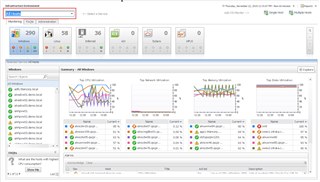
To add a host to monitor on it's own, switch the left-hand panel to Expert Mode, select the Infrastructure dashboard, and click "Single Host."
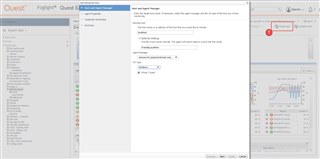
Fill in the hostname or IP address. Optionally, you can provide a friendly name. If you have more than 1 Foglight Agent Manager, select the one you wish to use from the dropdown.
Specify the type of host OS, and whether it's a virtualized or guest host.
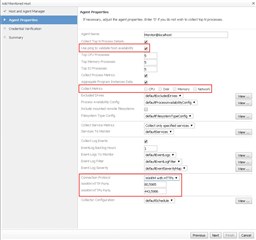
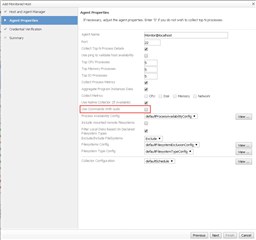
For a Windows host, there are some options to check that aren't on by default. "Use ping to validate host availability" will check from the Agent Manager selected above to the monitored host.
If you checked the Virtual box initially, you'll notice CPU, Disk, Memory and Network are un-checked. If you want the values from inside the host (OS level), then check these. You can also specify which connection protocol you wish to use. The Default setting will try WinRM (http then https) followed by WMI.
There are fewer options for a Linux or Unix host. "Use ping to validate host availability" is there along with "Use Commands With sudo". Check both if you want to do that.
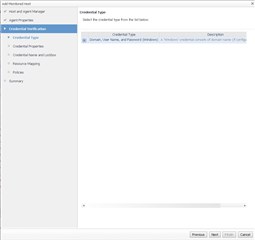
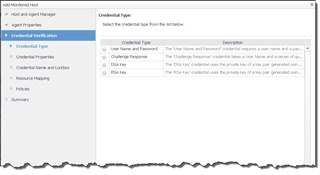
The credential options will also vary depending on the OS. Windows allows a Domain, User and Password while *nix has 4 options.
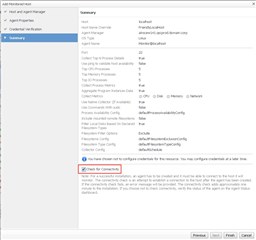
Once credentials have been set, a summary page will show all of the selected options.
Once the process has finished, wait 5-10 minutes before refreshing the Infrastructure dashboard. Make sure that "All Hosts" is selected in the Service dropdown.
For more information on Foglight, just click here.


