
Tweaking performance monitoring to work exactly the way you want
Spotlight on SQL Server comes ready out-of-the-box to help you navigate your SQL Servers’ performance metrics in real-time. The settings that define what Spotlight sees as healthy and unhealthy ranges for performance metrics come pre-configured to values that work well for most IT departments.
But Spotlight is highly customizable, and if you would like to make its alarms more or less sensitive than their default settings, that’s easy to do. And further, you can make these changes at a very granular level. Let’s see how:
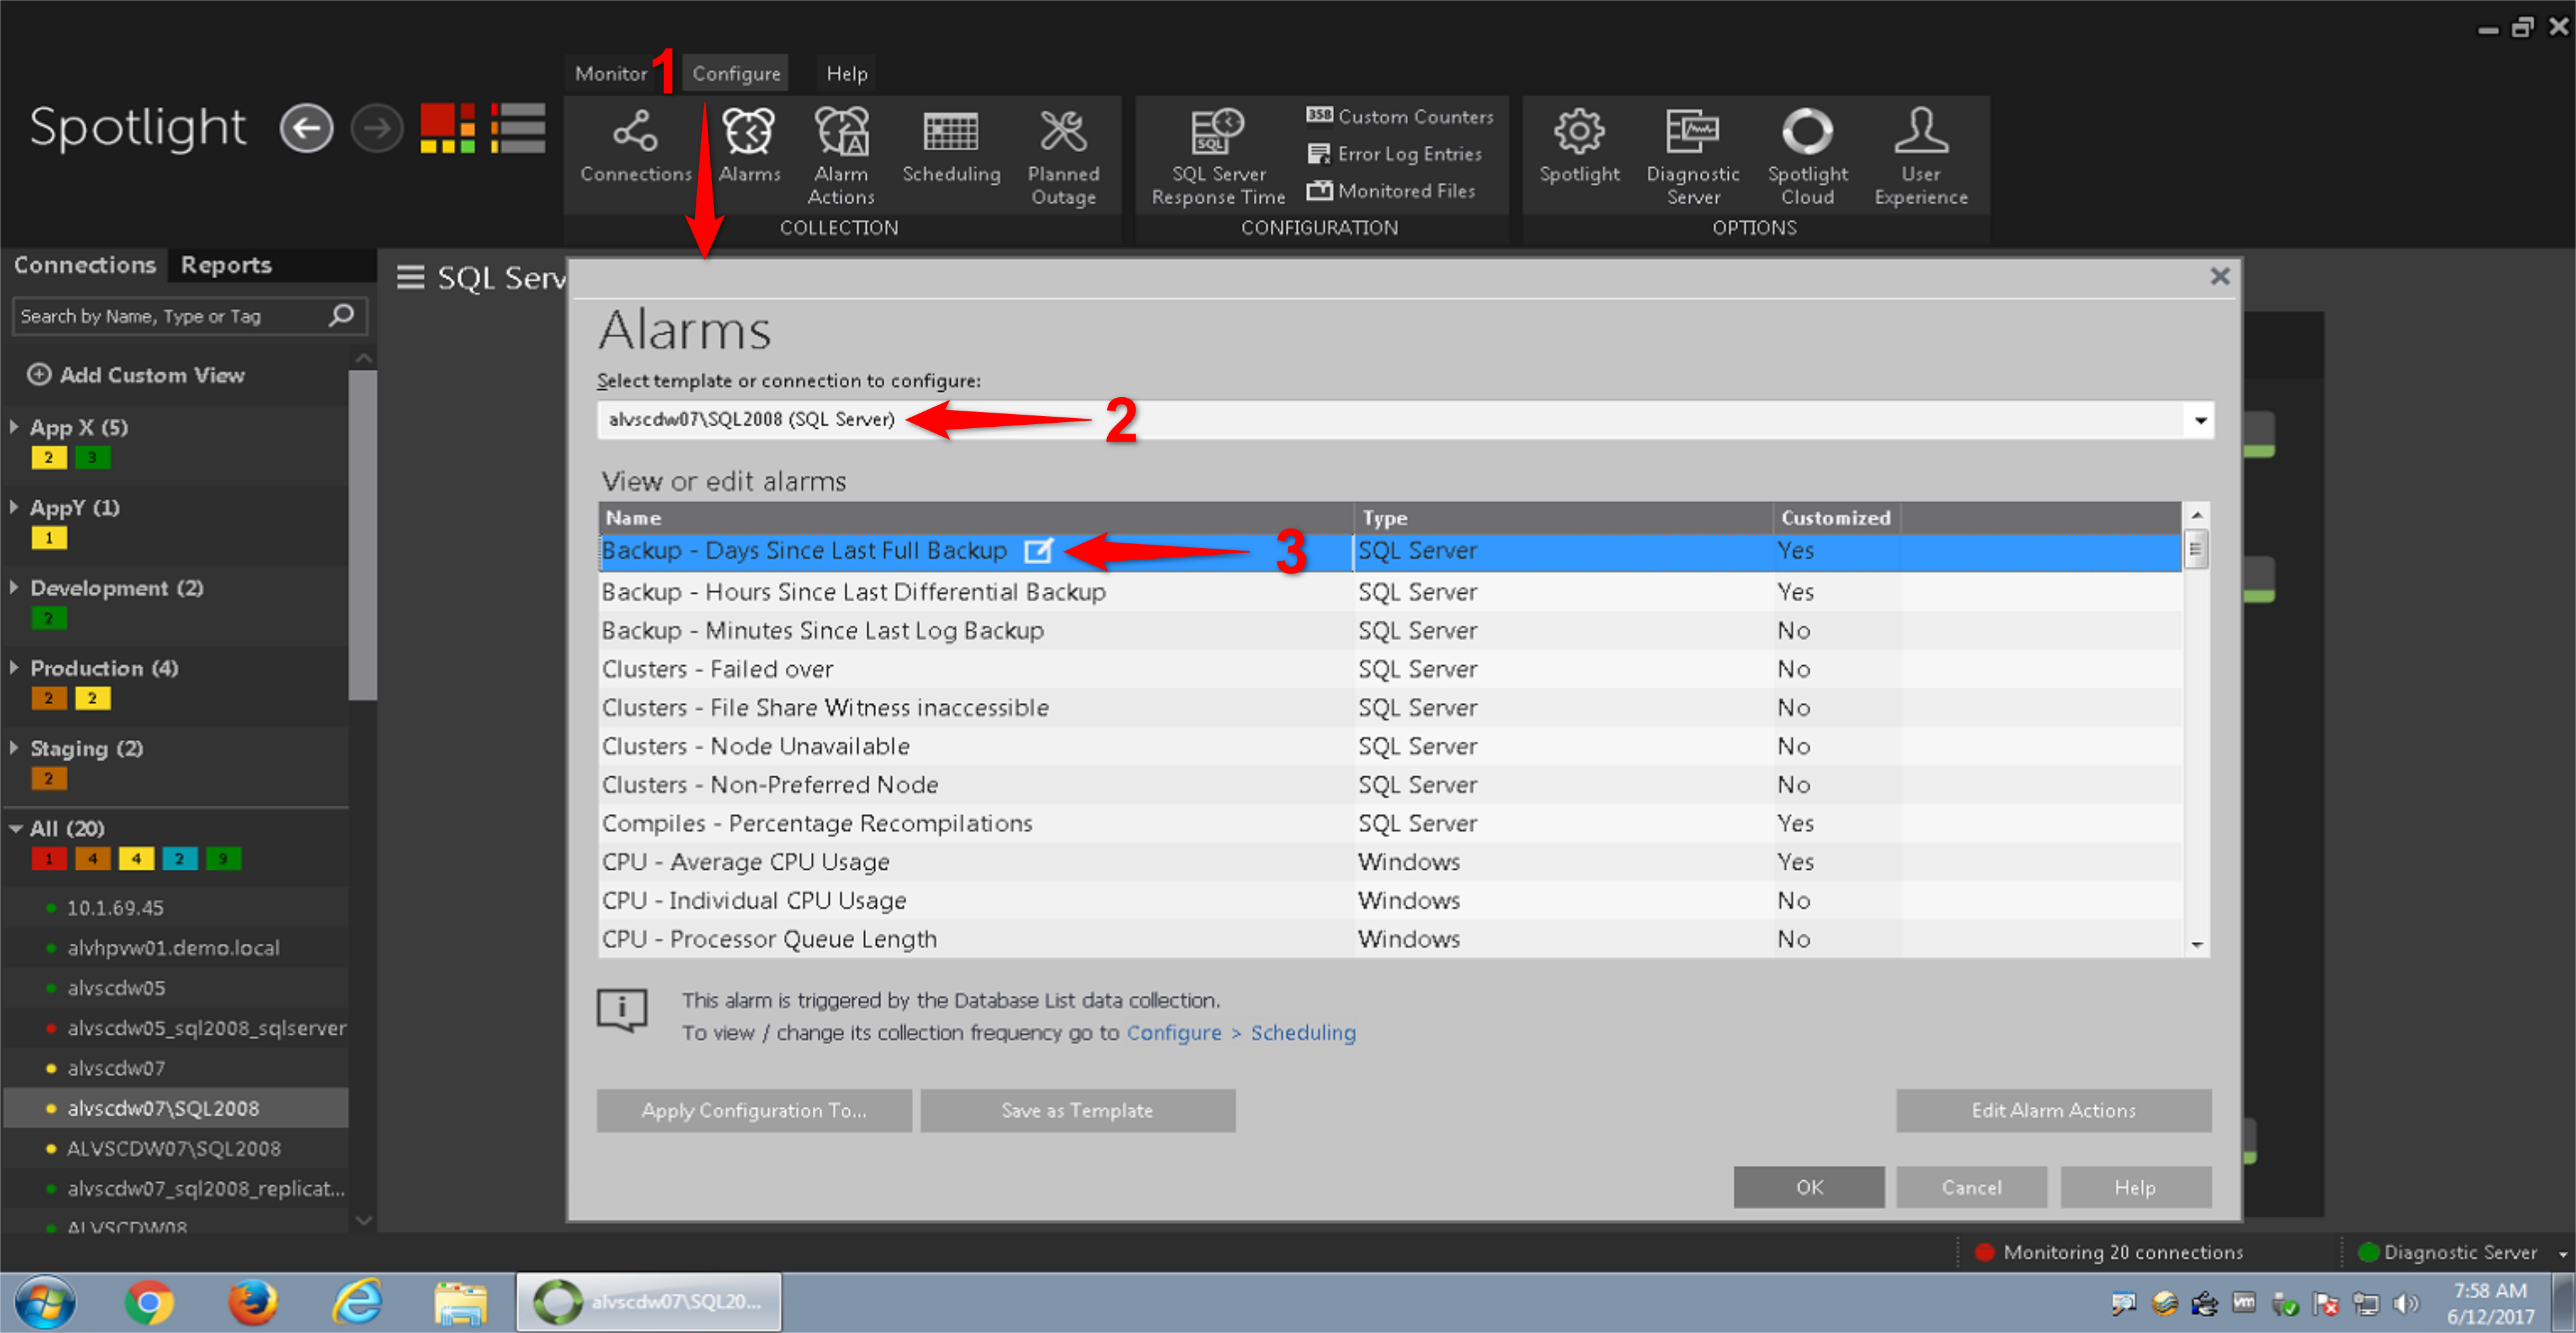
By navigating to Configure > Alarms as above (1), we can get to a screen that shows us all of the metrics that Spotlight collects, with access to the alarm settings for each. The dropdown at the top (2) indicates which system(s) you are viewing or editing the settings for. In this example I’ve chosen a single SQL Server – I’ll address later how you can adjust settings for a group of systems. We’ll use the “Backup – Days Since Last Full Backup” metric as our example. Clicking on the link icon to the right of the metric name (3) brings up its settings:
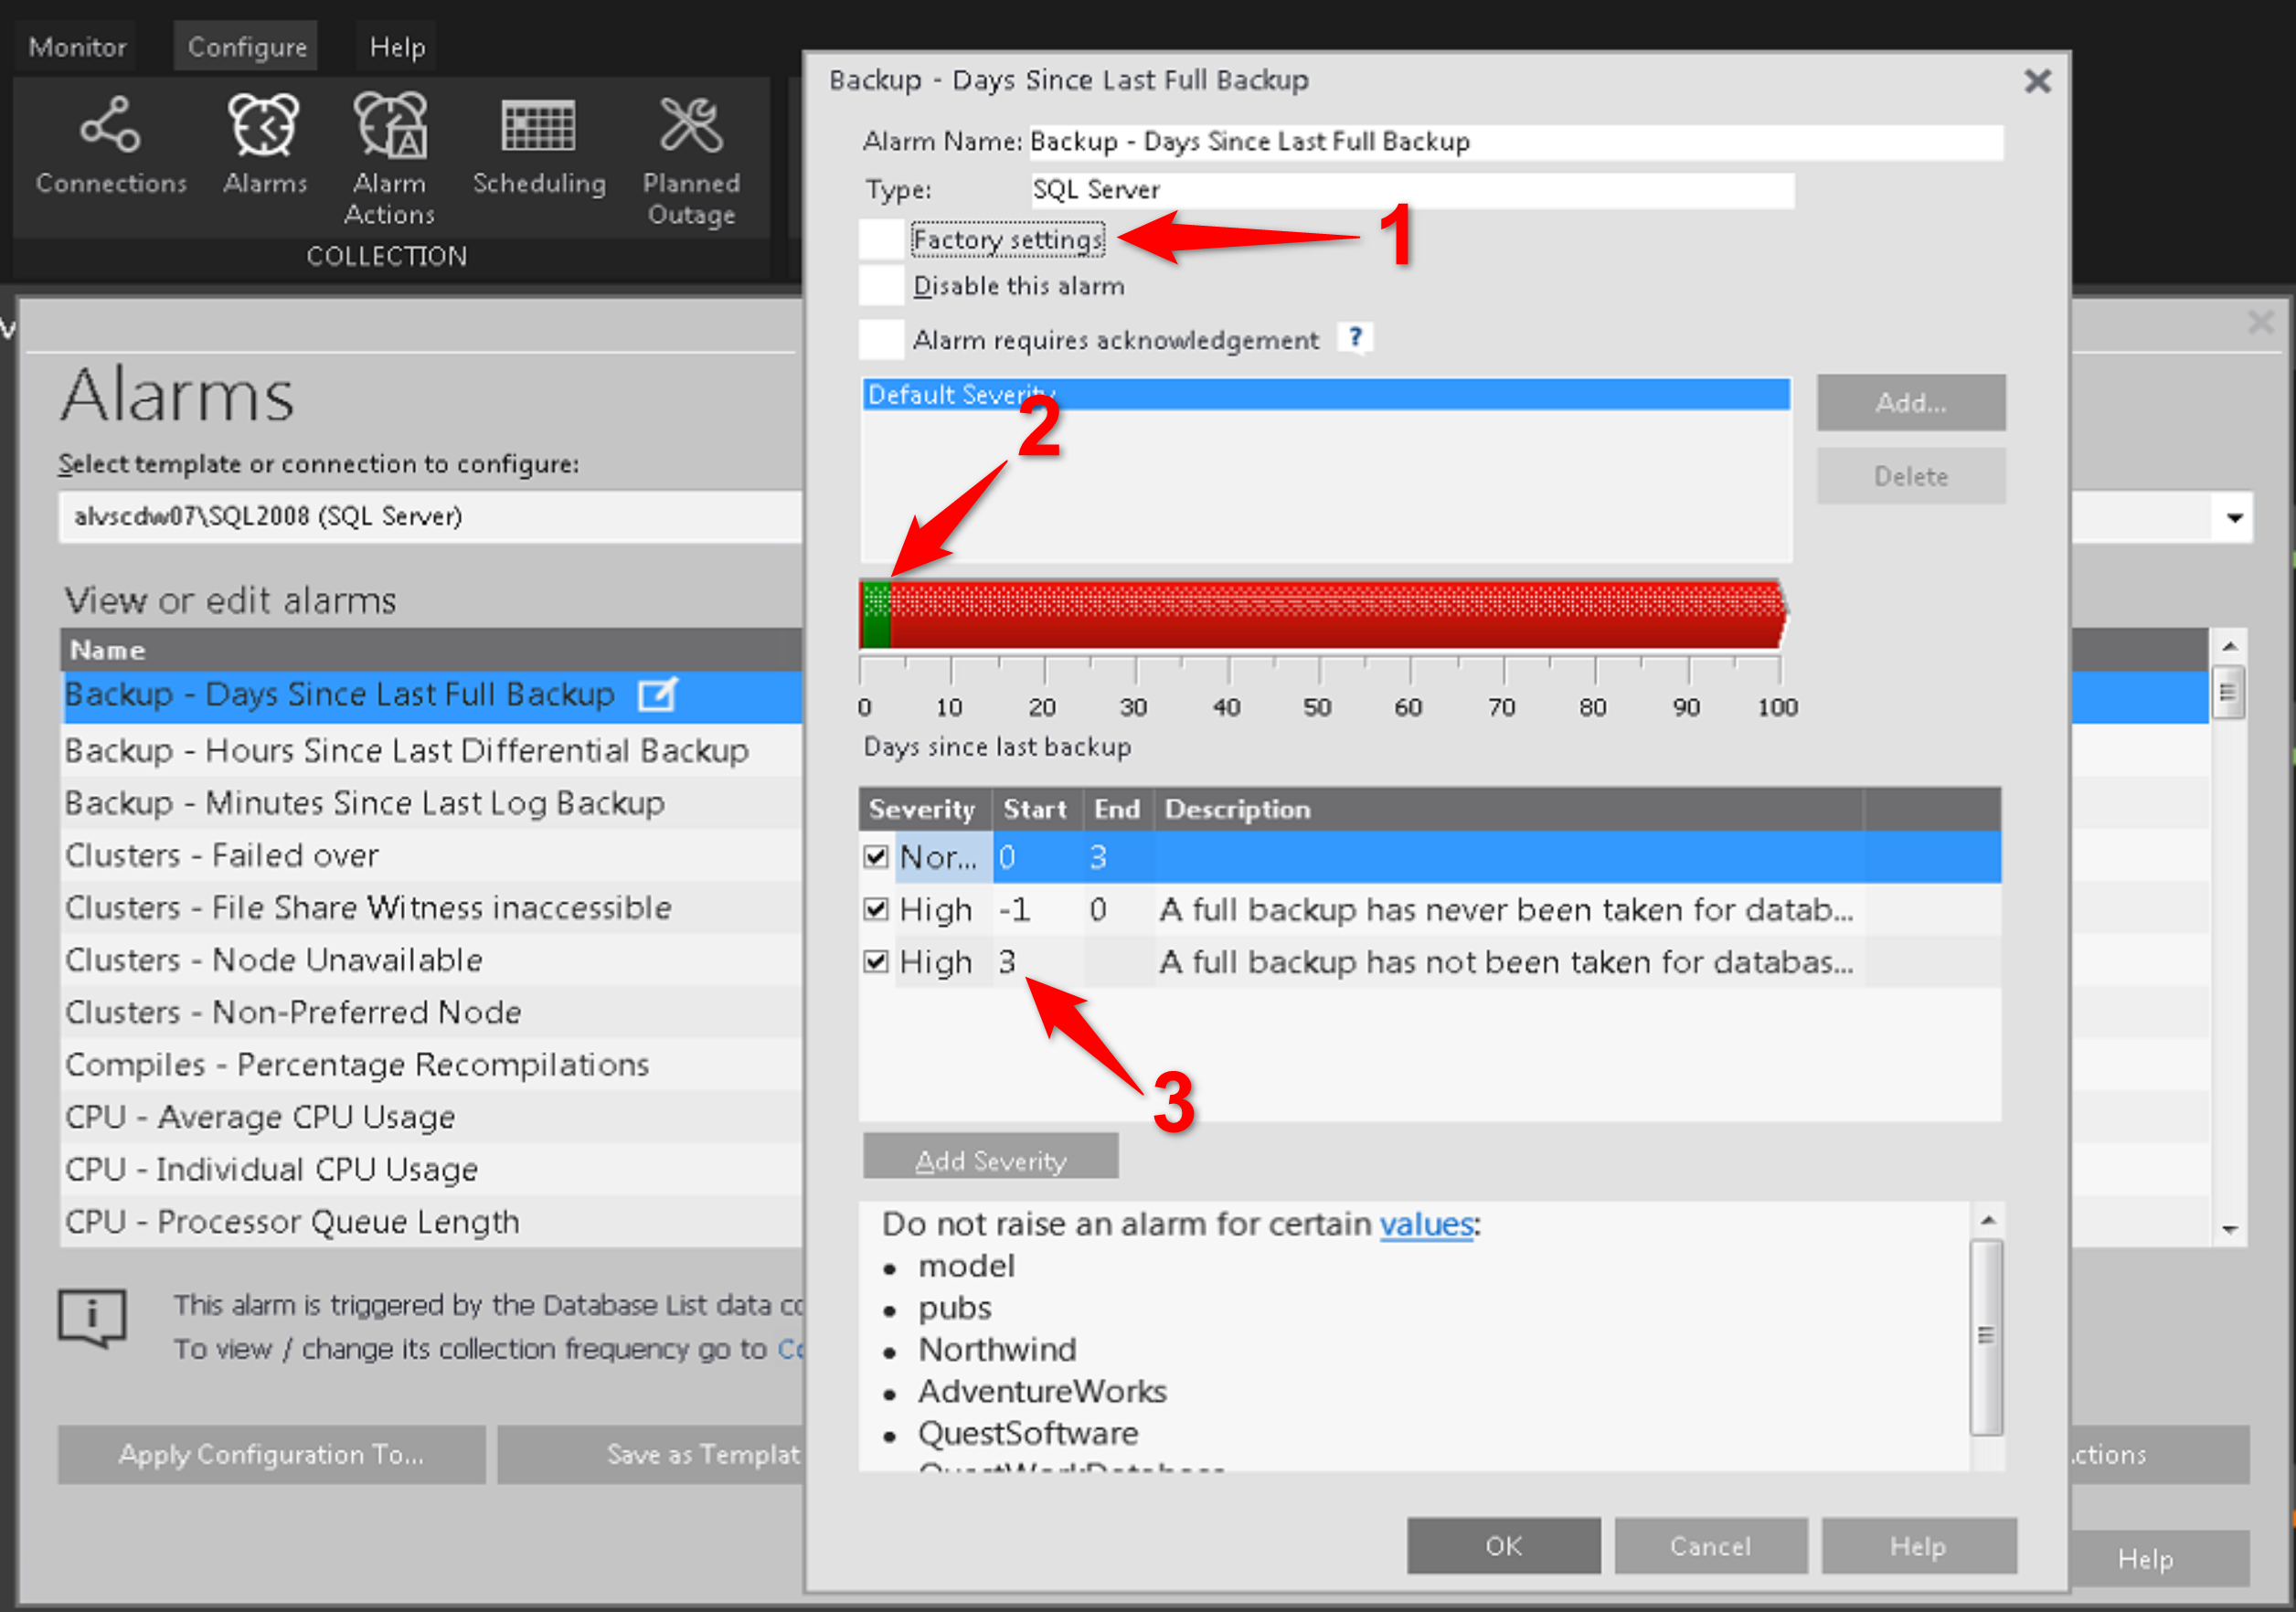
In the alarm settings popup, we’ll need to uncheck “Factory settings” (1) to be able to change the settings, which is done by either dragging the edges between threshold colors (2), or typing the desired values in the Severity list (3). For this particular alarm, the default of 3 refers to the number of days without a backup that triggers the alarm (just ignore row with the “-1” value – that’s the way that Spotlight encodes for the case when no backup history at all can be found).
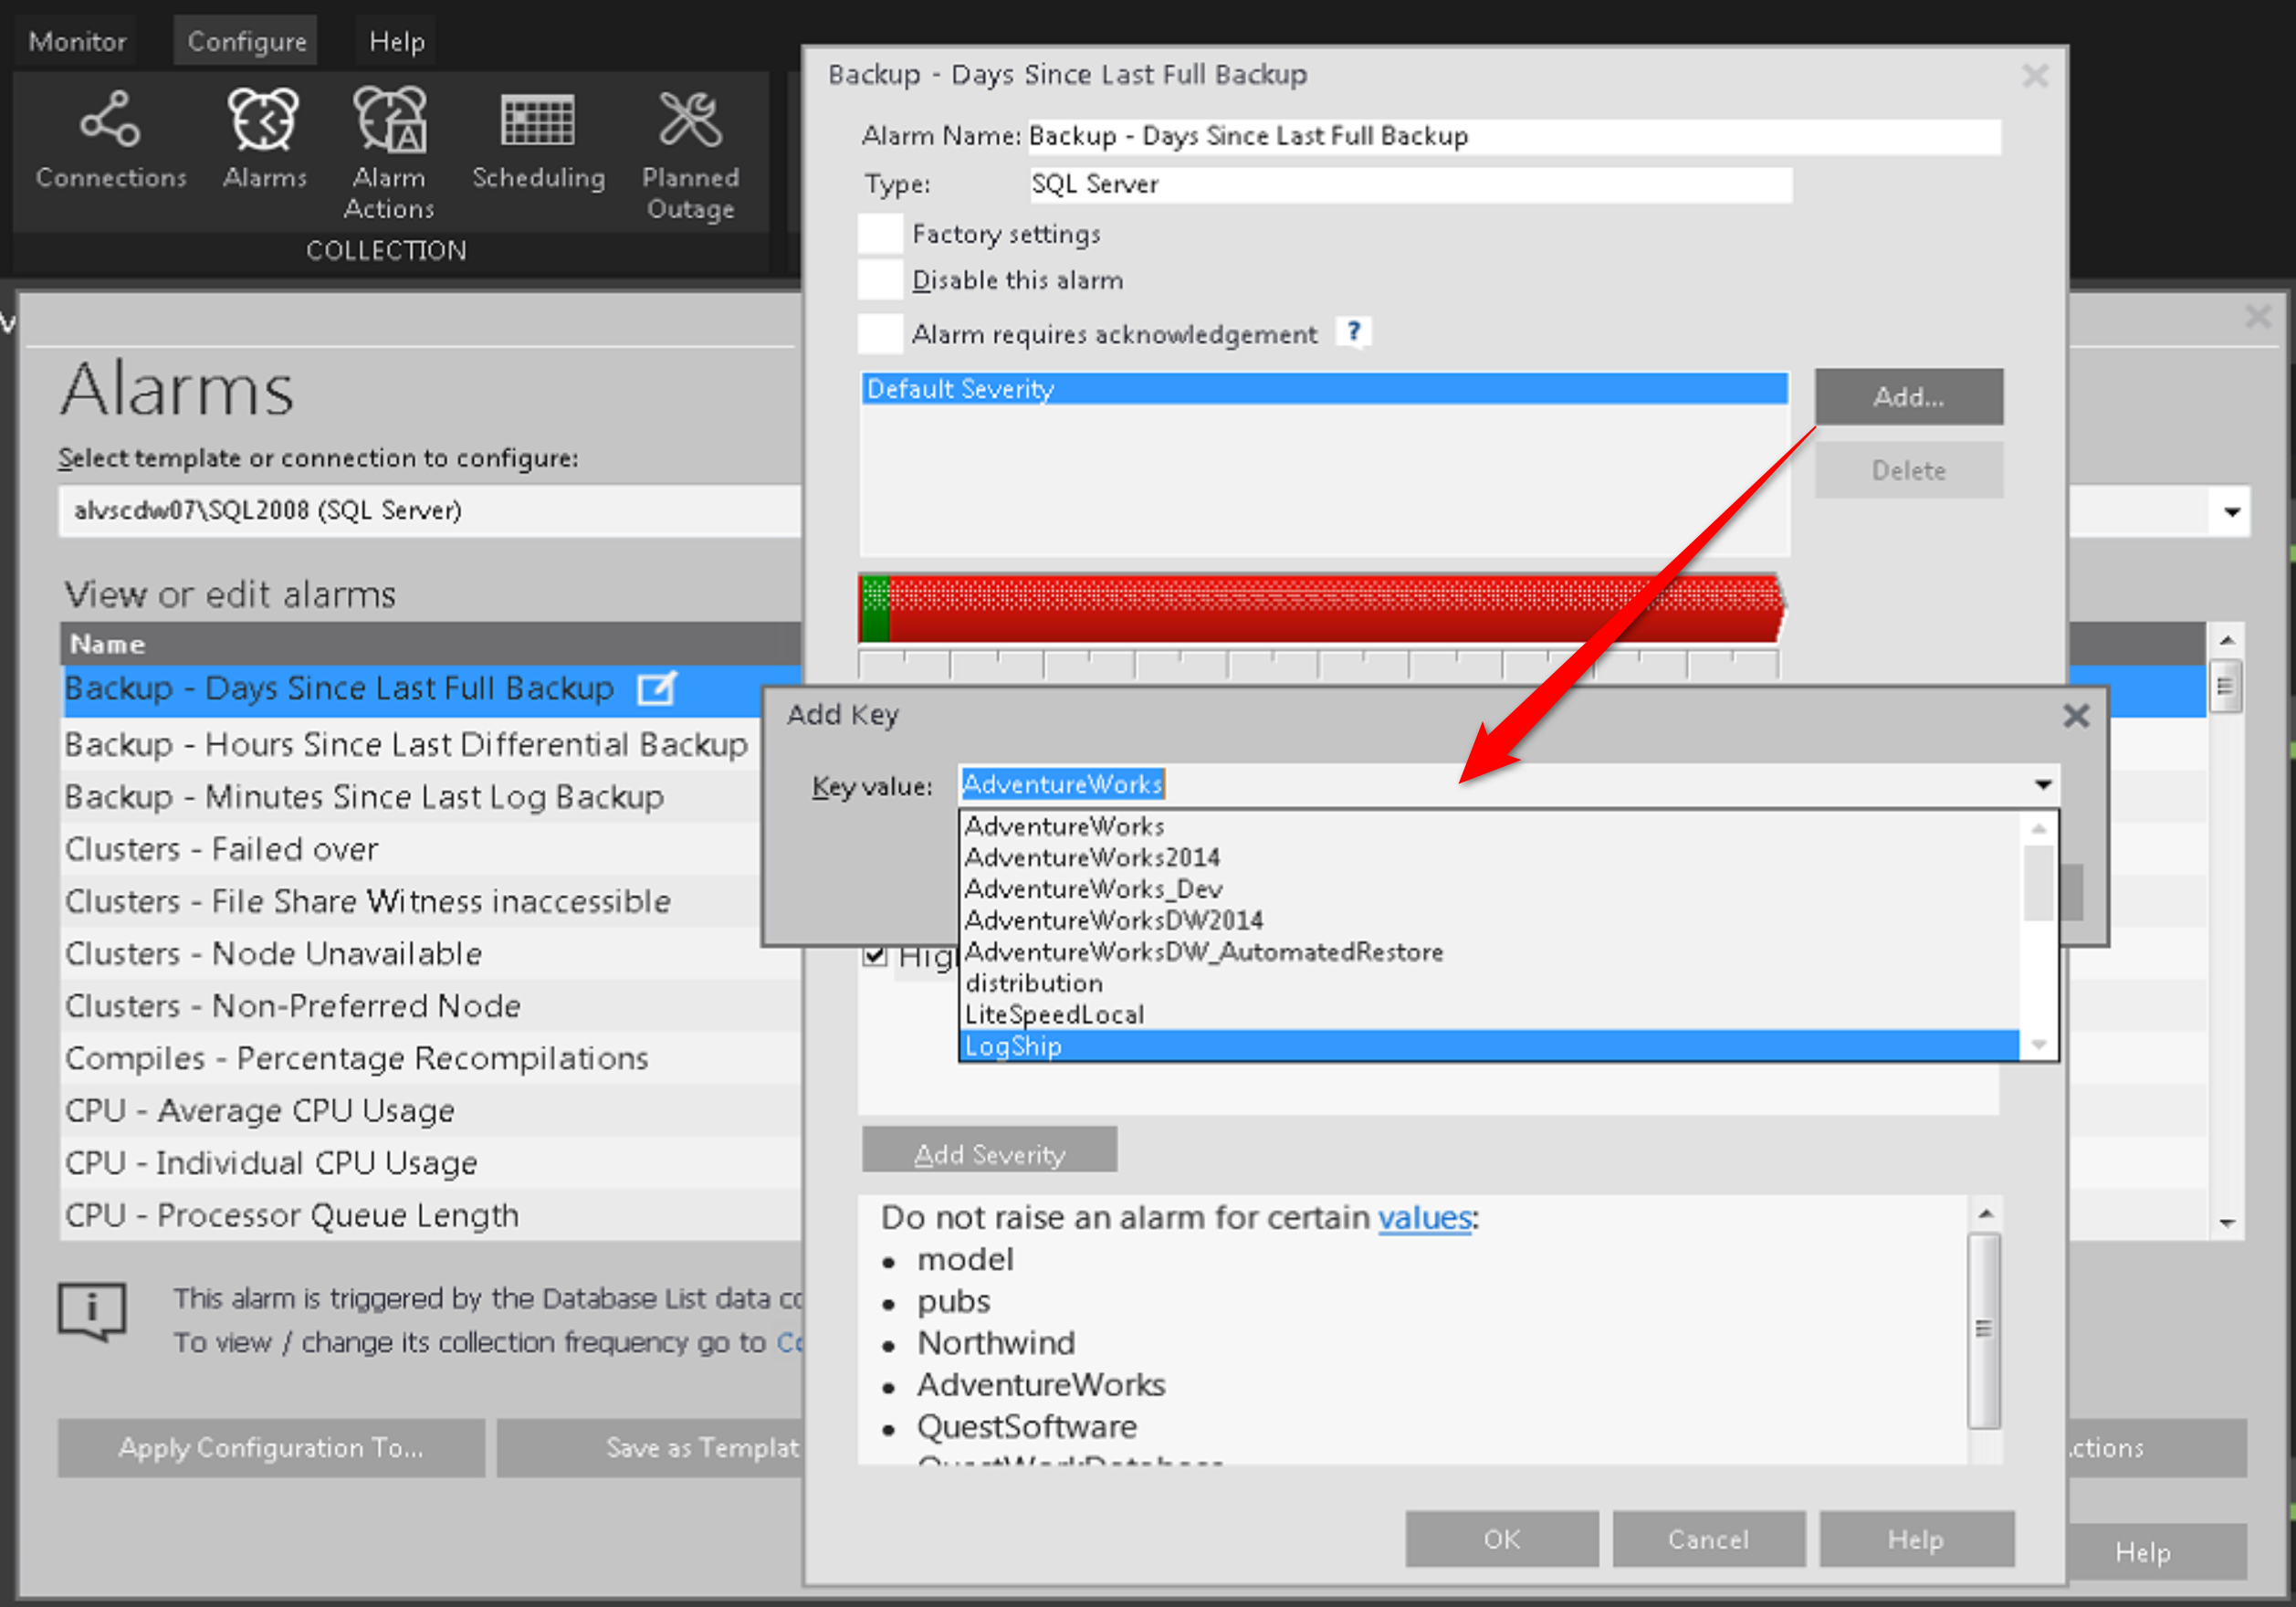
Now let’s talk about the scenario where you’d like the backup alarm for a particular database to work differently than it does for others. To do this, just click the Add button as above, and in the Add Key box that pops up, choose the database from the dropdown and hit okay.
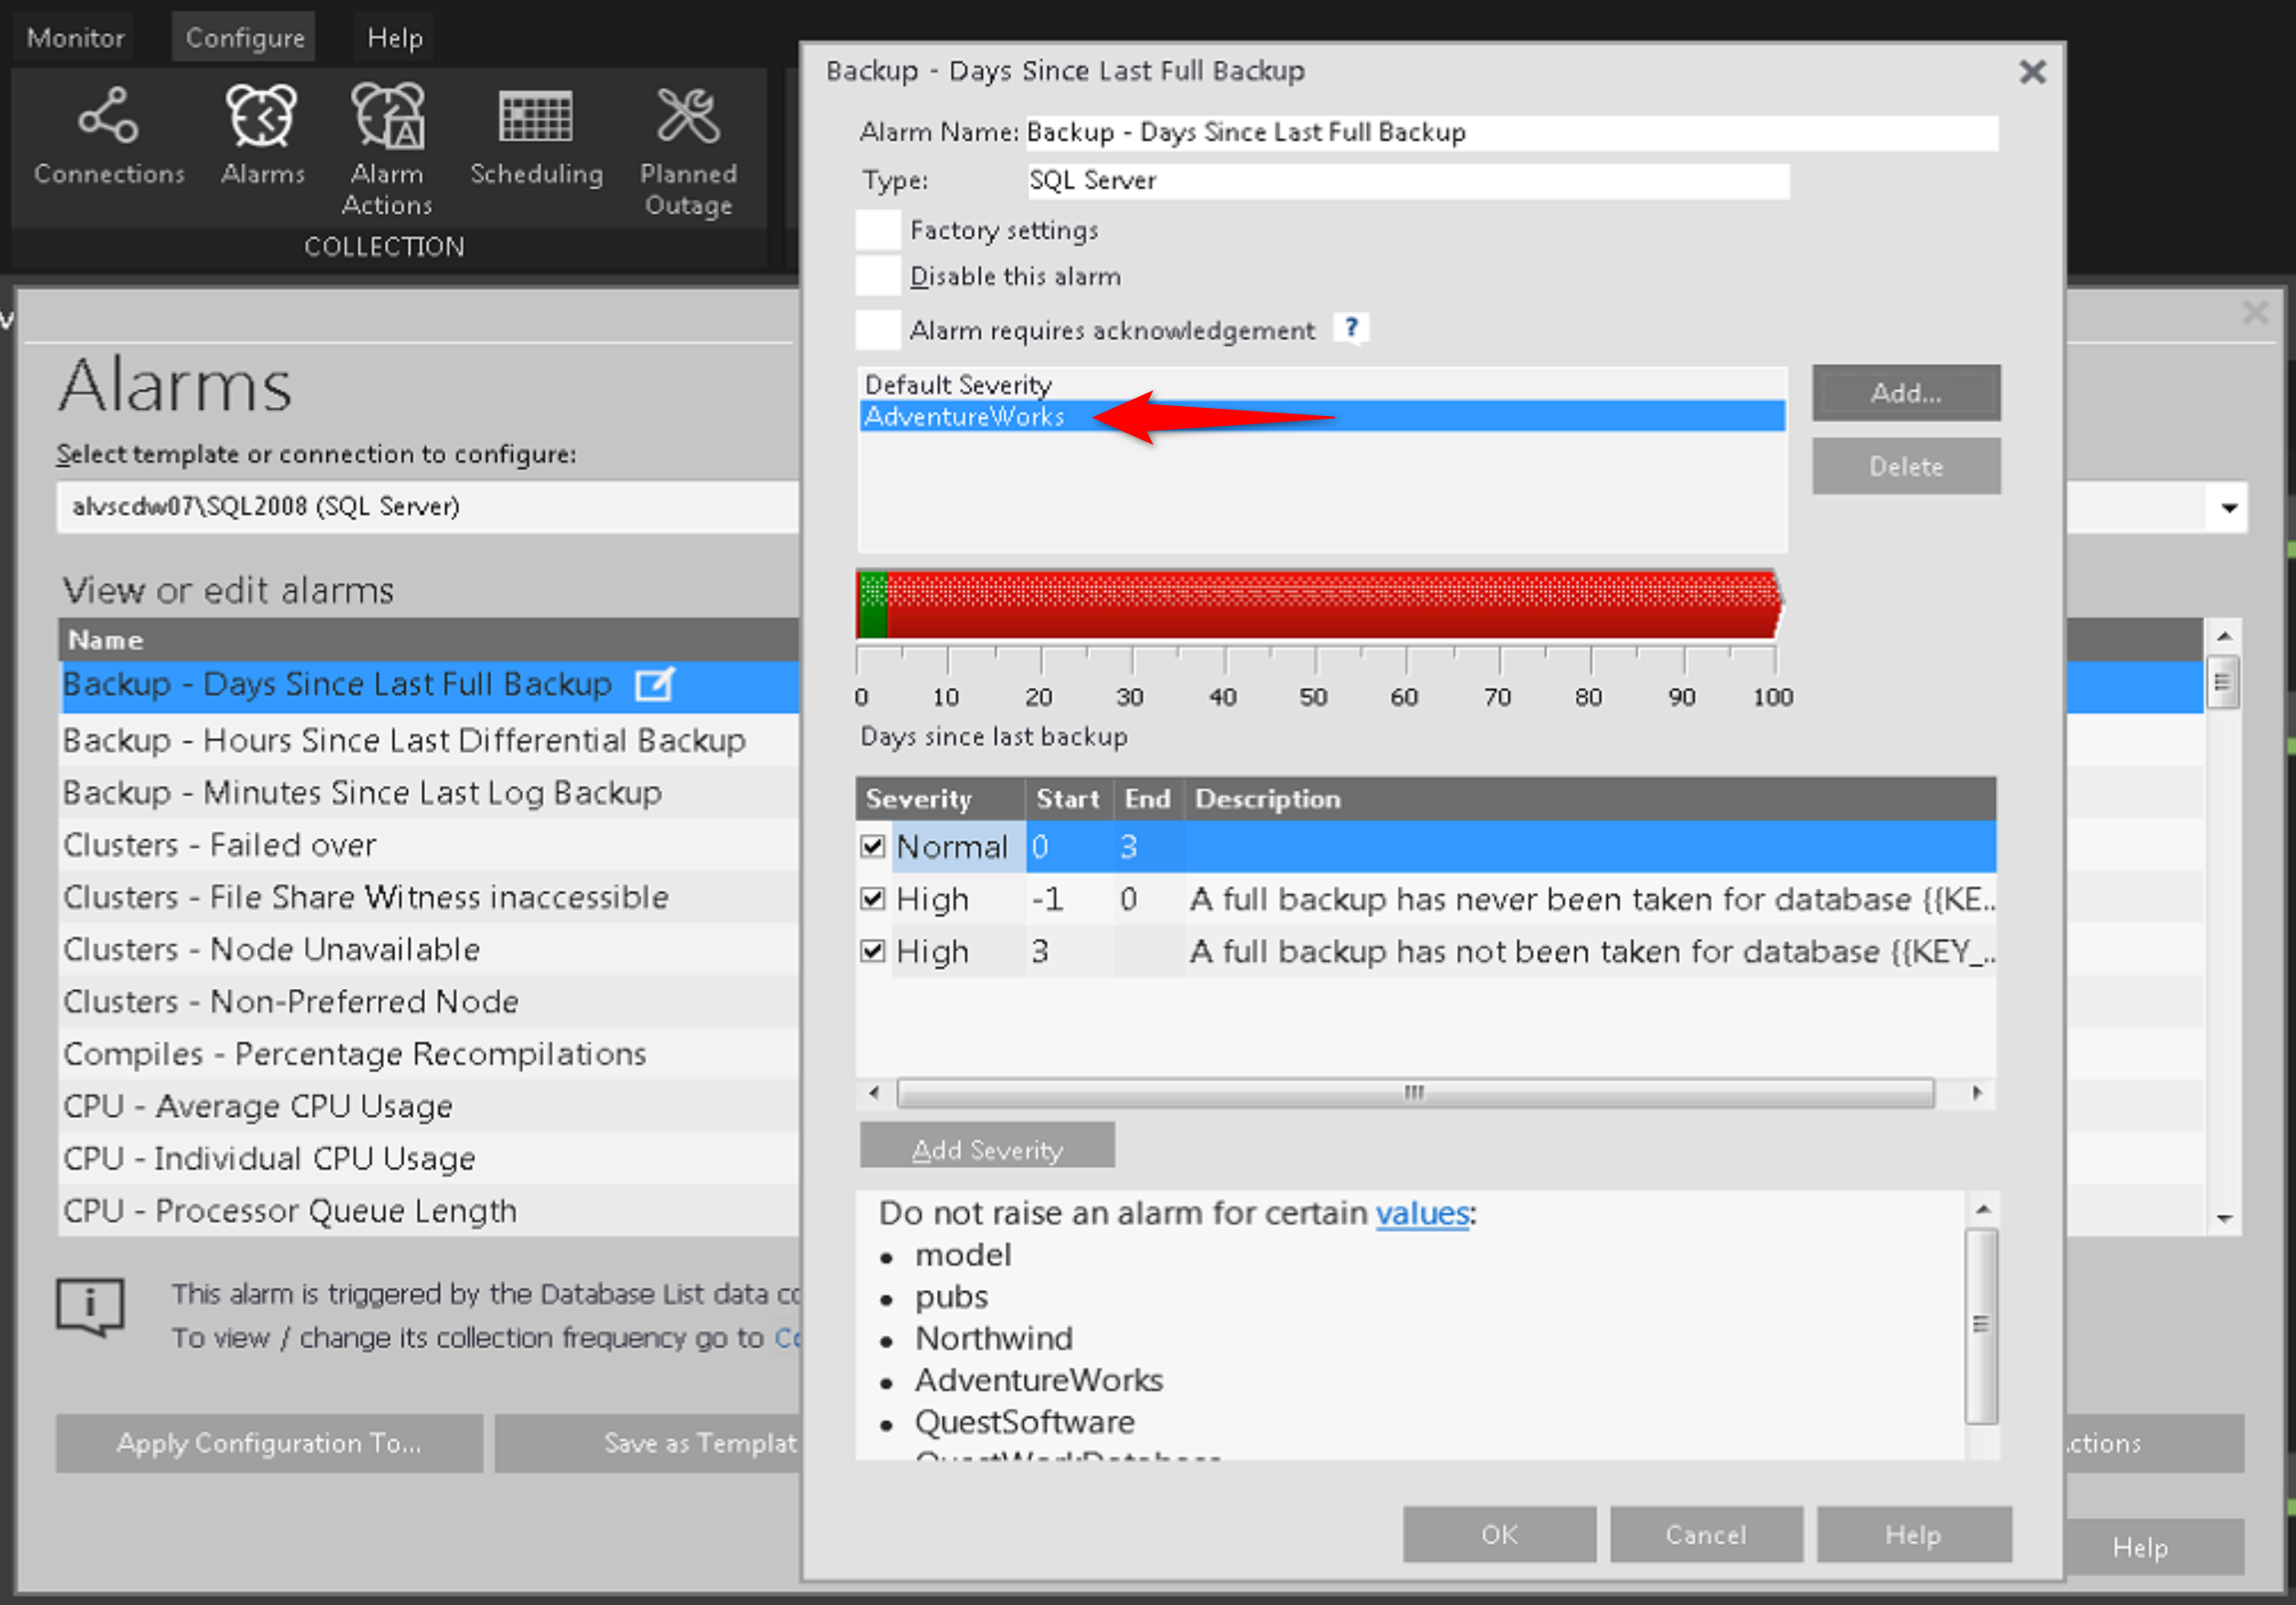
Now you’ve got a row for your particular database (Adventureworks in the example above) that you can highlight, enabling you to adjust the settings for it as already discussed. Any databases that aren’t given a custom setting in this way will be covered by the Default Severity settings.
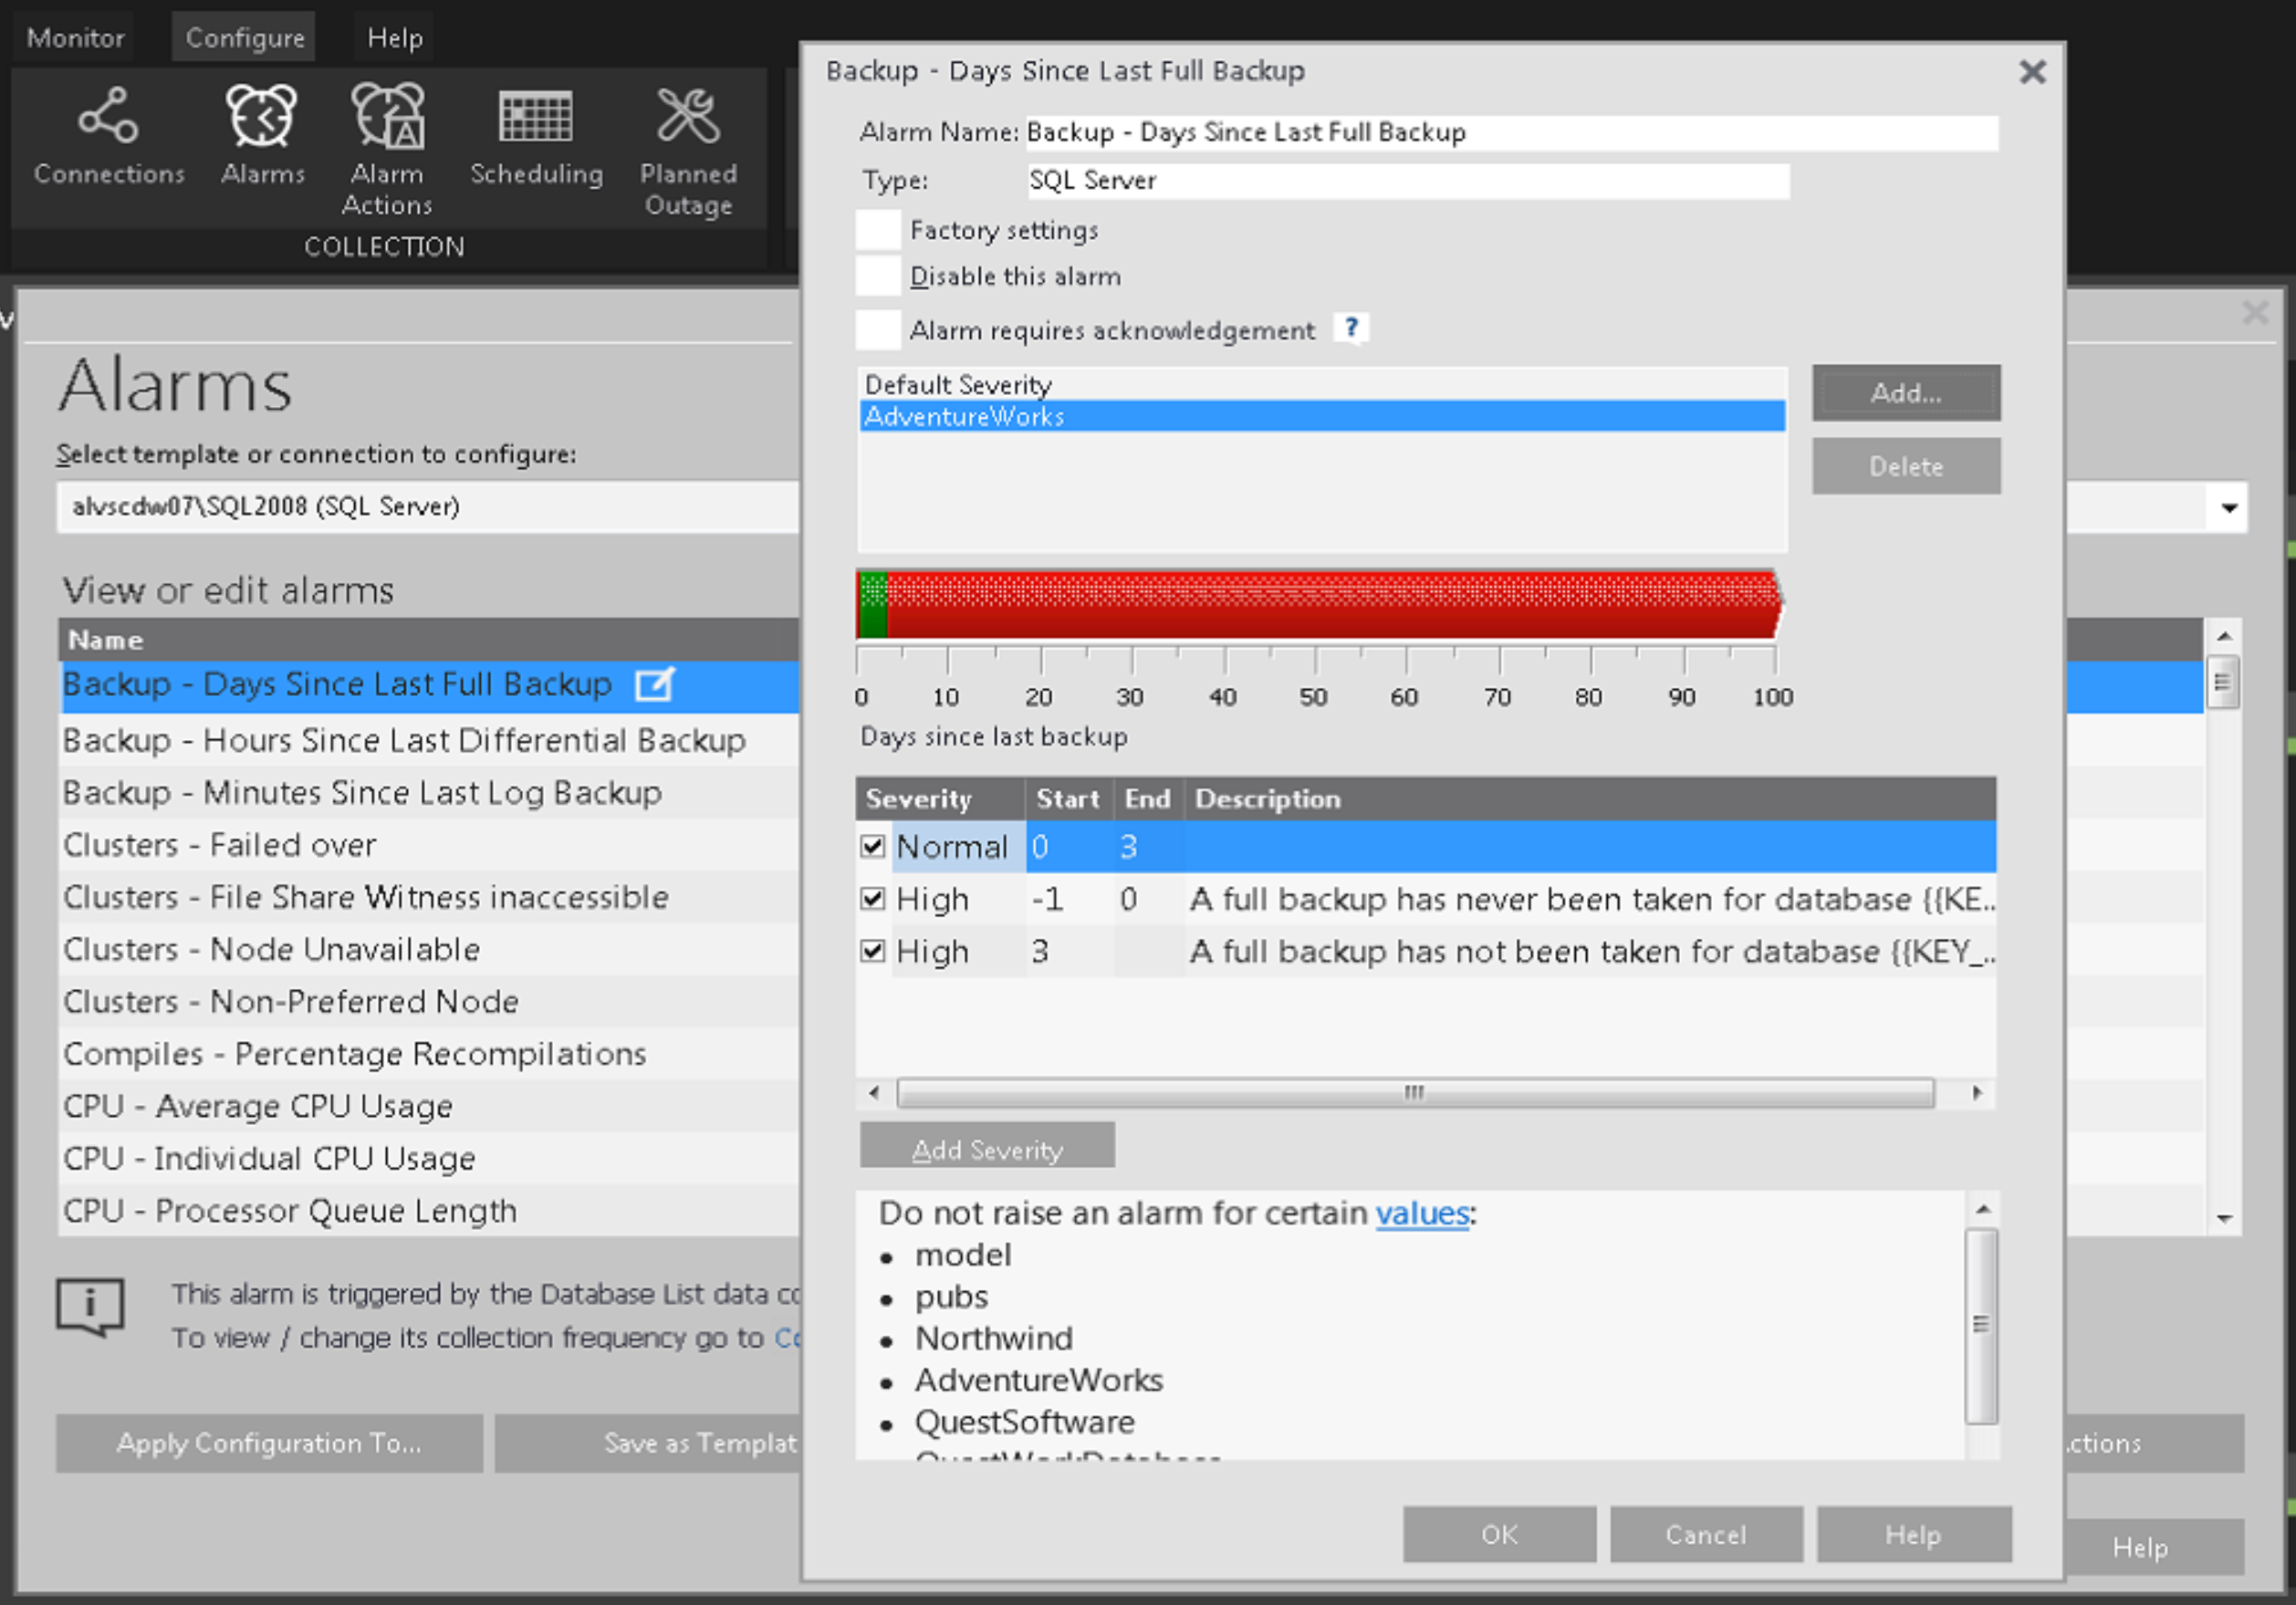
Let’s wrap up with a couple of additional options that you might have noticed on the settings screen. Near the top, there is a checkbox to Disable this alarm. And near the bottom, you can see a “Do not raise an alarm for certain values” list. Just like it sounds, this lets you add to a list of databases that this alarm won’t bother you about.
In this post we’ve covered adjusting the alarms settings for a particular monitored system. This can be a workable way to customize Spotlight behavior for a small environment, but for larger environments, you’ll want to know how to customize settings for group of connections.
If you haven't already, download our SQL Server performance monitoring tool today!
All of my Quest Database Performance blog posts can be found here.
