In the recent 5.7.5.50 release of Foglight for SQL Server, a change was made to the TempDB drilldown. Specifically, the Sessions tab would formerly show the current sessions, regardless of the time range selected on the dashboard. Now, it will allow you to drilldown to the sessions that had activity in TempDB during the desired time range.
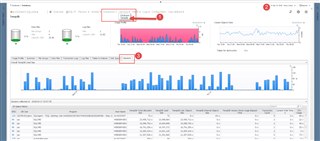
To start, drilldown to the Databases dashboard, select TempDB (1), select your time range (2) and then pick the Sessions tab (3).
Each bar represents a timeslice and hovering over it, shows the time range and the space used in TempDB. Also note that there is an indicator as to when the sessions were collected in the lower pane.
There are 2 paths that can be taken now.
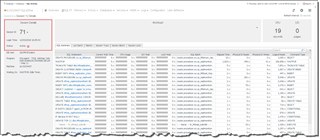
Clicking on the SPID will drill into the Sessions drilldown. This is good if the session is active. There are additional tabs you can use to view the current session data.
More than likely, the session will no longer be active, and there won't be too much to see. Take note however of the SPID and the login time.
One of the dimensions that SQL Performance Investigator tracks is sessions. This gives a second path to investigation.
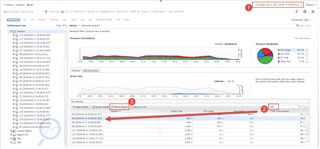
Drill into SQL PI and start by isolating your time range. Expand the "Sessions" dimension to get a list of sessions that were active during the time period. The search box (2) is helpful to narrow down the list. The Sessions column will show the SPID with the [Login Time] next to it. Click the session with the time that was memorized from the prior screenshot, then select Drill to Session.
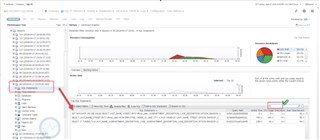
In the Performance Tree, the Session can be expanded and additional dimensions can be explored.
This is showing SQL statements that came from the session during the time frame. If nothing shows up, make sure to clear the search box from the previous step.
To explore Foglight further, please visit us here.


