
We often get questions from customers wondering how much overhead will be put on a database server when monitoring that server with Foglight for SQL Server and/or Foglight for Oracle. This blog post should act to explain exactly how Foglight collects and stores data, and what impact you may expect.
Foglight Collection Methodology
The first thing that I should make very clear, is that Foglight will not run any expensive traces* on your monitored database systems. (One exception is that for Foglight for SQL Server a deadlock trace is running in order to capture deadlock events. This trace effectively sits idle, waiting for a deadlock to occur and should cause no overhead to the monitored system). Foglight collects data from SQL Server via a set of built in Dynamic Management Views (DMV's), and collects data from Oracle via a set of Oracle Performance Views (v$). Foglight is collecting raw data from the database server, and all of the analysis, aggregation, and storage happens in a set of middle tier Foglight services, separated from the database server that is being monitored. This leads to a very lightweight collection from the database server, as the data that we are collecting is already there for us, and we are asking SQL Server and Oracle to do very little additional work in order to capture it. From an overhead perspective, this method is generally lighter weight that those which require running traces and/or extended events, as SQL Server is doing negligible additional work to present that data back to Foglight
Resource Overhead
In general, I would expect a 2-3% increase in CPU utilization on your monitored instances as a result of running the Foglight data collections. In most cases, you will see only a negligible increase, however in some scenario's it may be as high as 2-3%. There should be a negligible increase in IO utilization (as no data is stored on the monitored instance), a negligible increase in memory utilization (only enough to maintain the Foglight sessions that are running the collections), and a negligible increase in network utilization (especially when compared to the bandwidth being used by the database server itself). Even with the small increase in CPU utilization, we would not expect you to see any decrease in transactional throughput with Foglight on vs. Foglight off.
How to Measure
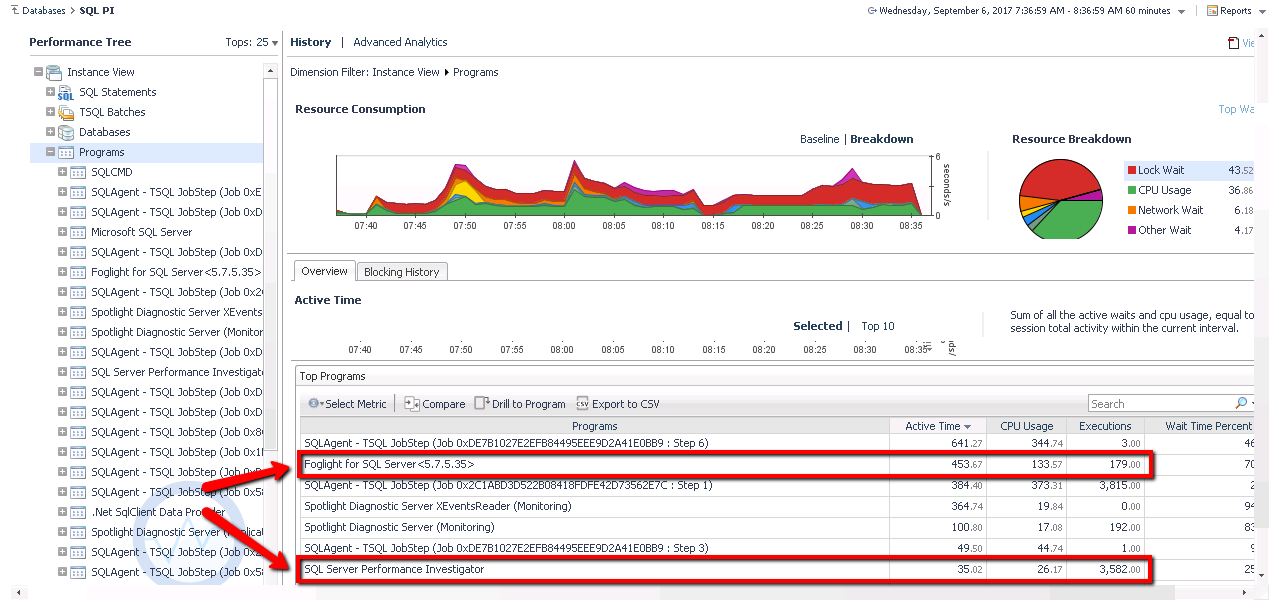
If you'd like to see Foglight's overhead for yourself, you can actually measure the resource utilization associated with Foglight's data collection in Foglight itself. By default, Foglight does not show all of it's activity against your database servers, however running a simple script will expose it completely. In the screenshot below of the SQL PI drilldown in Foglight, you can see that I have drilled down to the "Programs" dimension and can see the resource utilization generated by two programs related to Foglight. One will be listed as "Foglight for SQL Server..." (or Oracle) and the second will be called "SQL Server Performance Investigator". The SQL PI queries in Oracle will show in the Modules dimension, and will be associated with a "Foglight for Oracle" module, along with a JDBC think client module Adding up the resource utilization of these two programs will give you a rough estimate of the overall utilization of Foglight. In the example below, Foglight and Performance Investigator combine for roughly 159 seconds of CPU time. In a given hour of time (as is shown in the example below), there are 3600 seconds of CPU time per core. This is a 4 core server, so out of 3600 x 4 = 14,400 possible seconds of CPU time, Foglight consumed 159. Dividing 159 by 14,400 shows that Foglight used roughly 1% of the available CPU on this system. The math isn't an exact science, but should give you a helpful perspective. If anyone would like access to the script that will expose all of Foglight's activity in the PI drilldowns, please contact me through the community, and I can make it available.
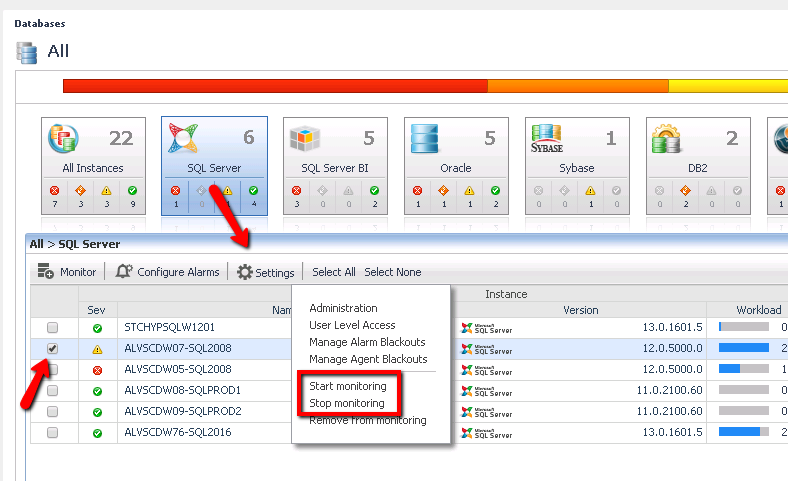
Another method of monitoring the overhead of Foglight, is to use Perfmon (or other tool) to track the resource utilization of Foglight with Foglight on versus off on a given database server. You can easily start and stop monitoring using the Foglight global Databases dashboard.
Summary
As you can see, the collection methodology that Foglight uses should result in a very lightweight data collection on all of your monitored database servers. You can also use Foglight, along with additional monitoring tools to easily monitor the overhead that it puts on your own systems. Lastly, there may be some edge cases where the overhead is higher than what you are comfortable with. The Quest Technical Support team is always willing and able to assist with diagnosing issues related to high overhead, and can also recommend configurations in Foglight to tune the overhead for a particular database server.
Hope this was helpful!
