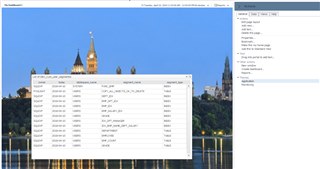
This post will cover one way to make it easy easier to get the user-defined collection data onto a dashboard or report.
For a quick refresher, please see User Defined Collections in Foglight for SQL Server: A Quick Walk-Through
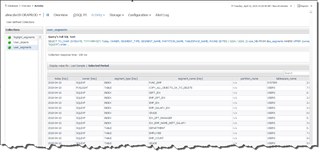
With a "simple" UDC that returns a single value, adding it to a dashboard or report is a matter of finding it in the data model, and dragging it over. But what happens with a query that returns multiple rows and/or columns? The results can be viewed in the Databases dashboard drilldown:
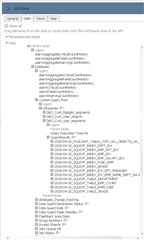
To find it in the data model in order to drag onto the dashboard (this is for Oracle; SQL Server is similar), drill into Databases -> Oracle -> Instances -> <Instance_Name> -> Parent Node -> Database -> Custom Query Root -> AllQueries -> DBO_Cust_name_of_your_collection -> QueryResults
There is a topology node for each row returned. That's not going to help since only 1 object at a time can get moved to the dashboard. The goal is to build a table similar to the first screenshot above.
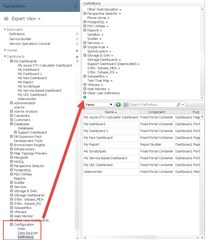
One way to expose the data is by creating a UI Query. Navigate to Configuration -> Definitions. In the list of modules, scroll to the bottom, and click the green (+) to add a system module. This is where the queries will be stored. (I used my name).
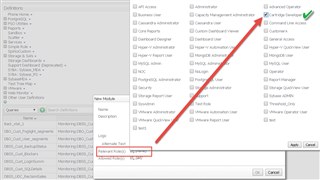
For the relevant and allowed roles on this module, set at a minimum "Cartridge Developer". Any objects created under the module (eg. UI Query) will inherit this setting.
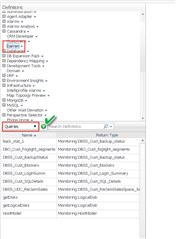
Find your new module, then select "Queries" from the pulldown in the bottom pane, and click the (+) add icon.
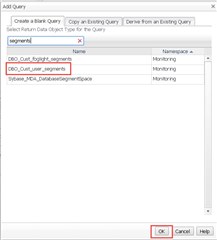
Create a blank query, and type part of the user-defined collection name in the box. (I want "DBO_Cust_user_segments in this example.)
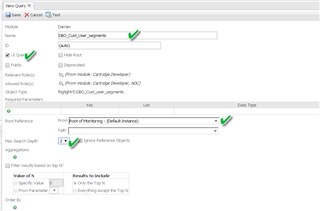
Start filling out the required fields. Give the query a name and make it a UI query. The Root Reference is where the data will be pulled from in the data model. Start with "Monitoring (Default Instance)" as the From path:
For the path, it's DBO_Data_Model/clusters/database/custom_query_root/allQueries/queryResults. Easy, right?
Click "Test" to see what data comes back, then Save to commit the query.
Navigate back to "My Dashboards" and your dashboard / report name, or create a new one from the Actions panel -> General tab.
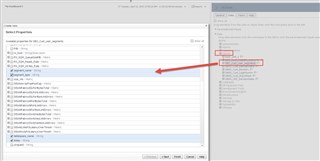
On the Data tab, a new node with the system module that was created to store the UI query should appear. Expanding it will show the query. Drag the query name over to the dashboard/report canvas.
Pick "Create a table" from the options, then select the columns to display. Next, next, finish, and a nice table with user-defined collection data should appear. The layout, etc. can then be adjusted to suit the style as needed.


