
I've done a number of posts recently that touch on Foglight administration, customization, or some of the more advanced capabilities of the product. I felt it was a good time to circle back on some of the more basic use cases that Foglight can help DBA's with. In this series of posts, we'll take a look at some of the more common challenges that DBA's face, and show you how Foglight for SQL Server can help you be more effective, and efficient in your day to day tasks.
In this post, we'll take a look at blocking. As any DBA has likely come across, excessive blocking on a SQL Server instance can cause significant slow downs of production applications, and those blocking scenario's that have occurred in the past can be very difficult to track down.
If you have a production system that experiences frequent blocking, please follow along with this post to determine how to diagnose blocking in Foglight. If you are evaluating Foglight, or would rather step through this example on a non-production system, I've included instructions on how to simulate blocking activity at the end of this post.
1) Getting Notified When Blocking is Occurring.
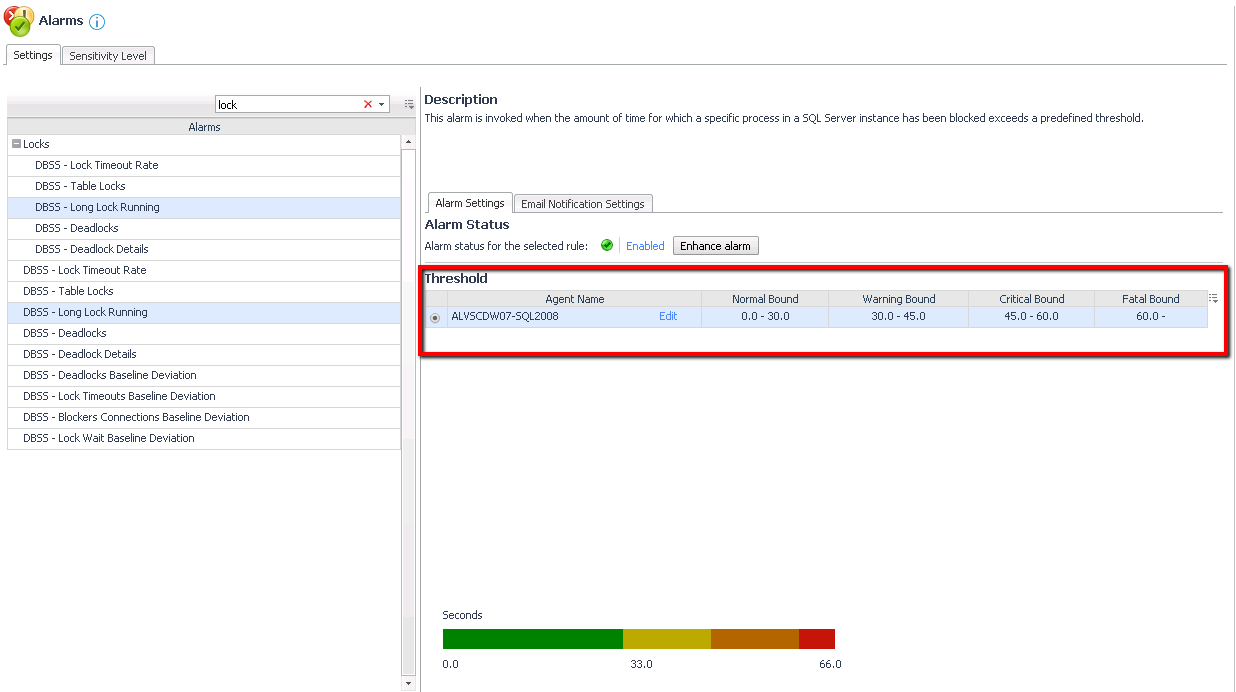
The first challenge with blocking, is knowing when it is happening, ideally before your end users open a ticket or send you a notice. Foglight for SQL Server includes an alarm that can help you be proactively notified about long running blocks. The alarm is called "DBSS - Long Running Lock", and evaluates against thresholds (in seconds) to alert you when a block lasts for longer than a specific duration. In the example shown below, a warning level alarm is fired for a lock longer than 30 seconds, a critical level alarm for one longer than 45 seconds, and a fatal alarm for one longer than 60 seconds. These thresholds can be configured to meet whatever requirements you may have. The "Email Notification Settings" tab of this alarm can be configured so that you are notified when this alarm fires.
2) Diagnosing Blocking in Real Time
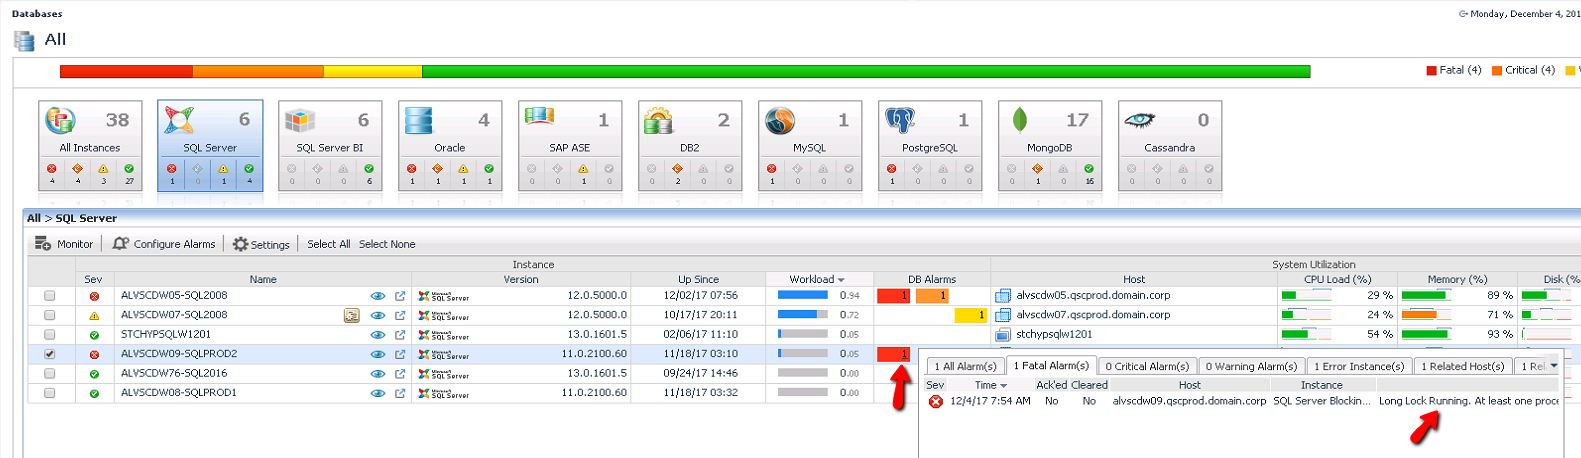
If you are following along with this blog, this would be a good time to fire up a blocking scenario (instructions at the end of this blog). Once a blog is detected by Foglight, the alarm will fire. If you have notification configured, you should have the e-mail in your inbox. You will also see the alarm visually in the Foglight Global Databases dashboard:
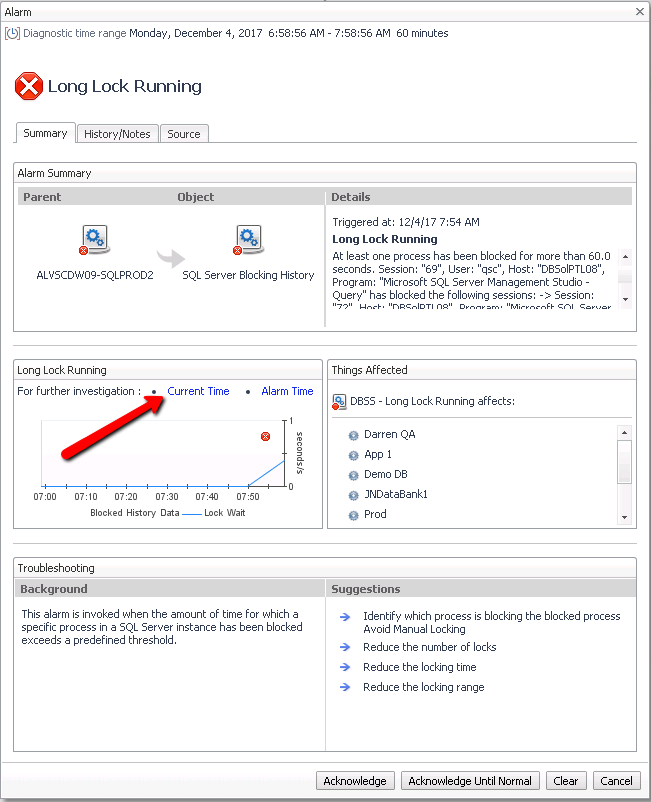
You can click on this alarm for more details, as well as a link to diagnose this problem in the real time blocking dashboard in Foglight:
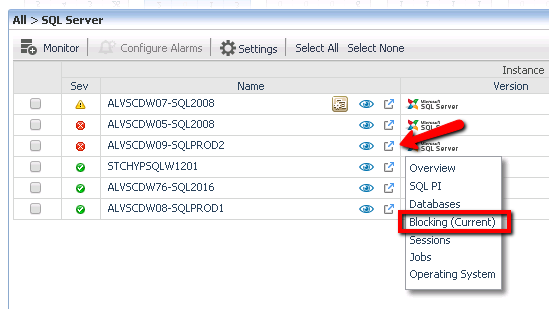
Another way to navigate to this drilldown, is that from the global view you can click on the drop down menu next to the server name, and select the Blocking (Current)
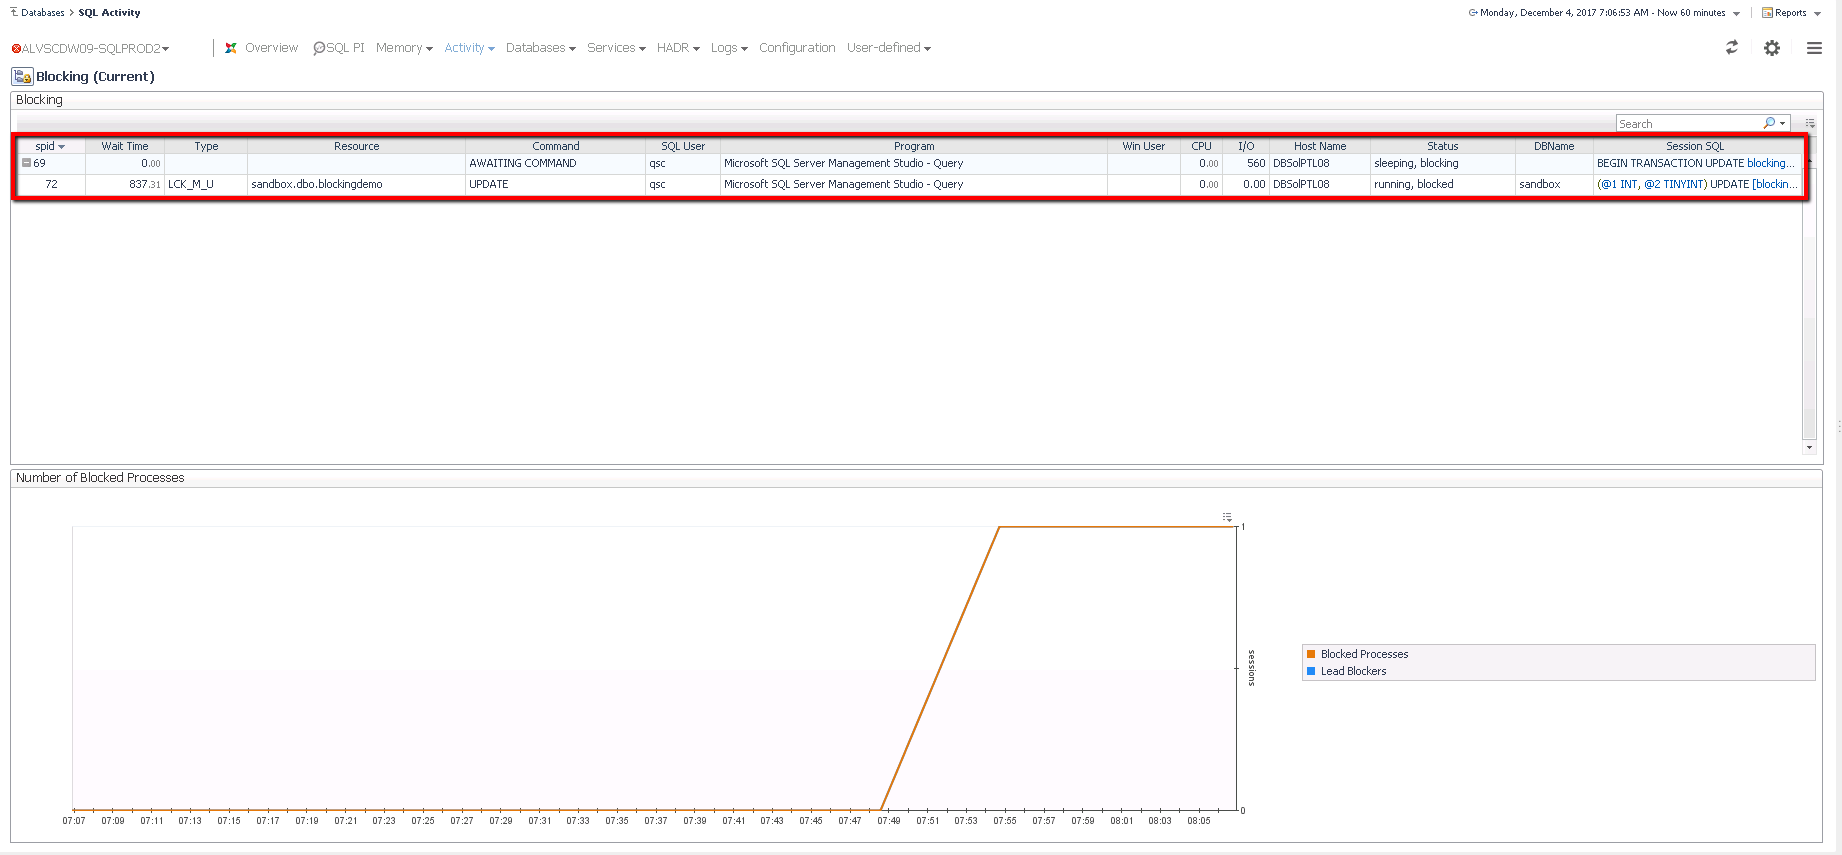
Once in this drilldown, you will see the full details of all current blocking scenarios, including the sessions involved, objects being locked, SQL Statements running, and more:
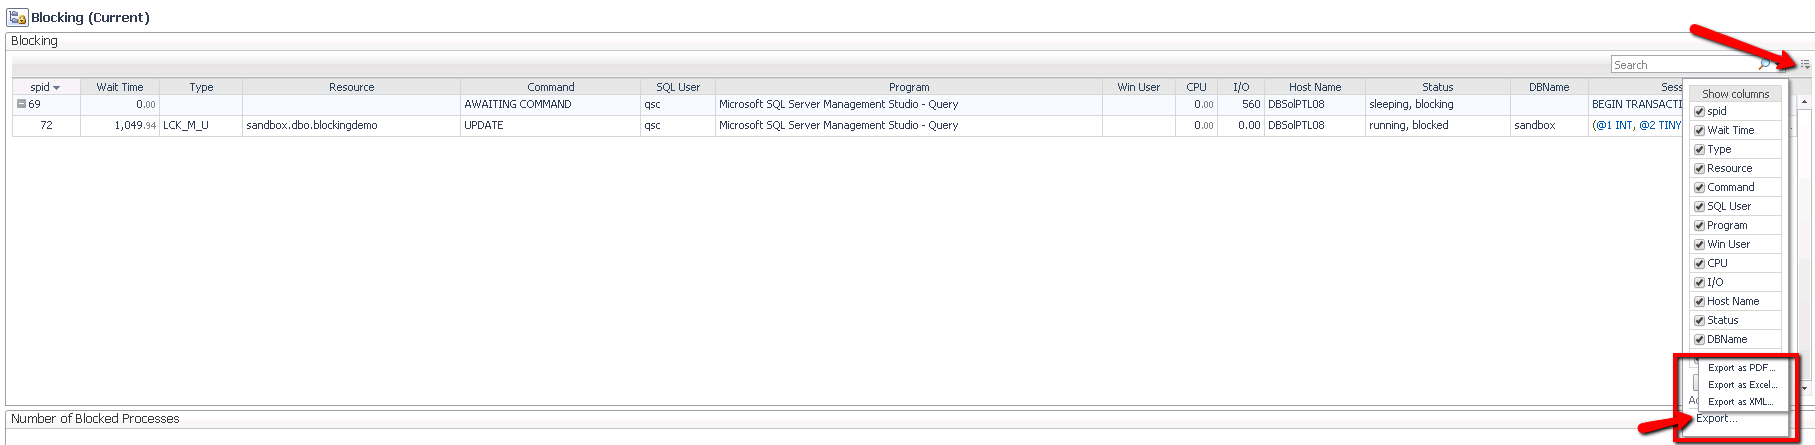
This list can be viewed inside of the Foglight console, and can also be easily exported to a variety of file formats by clicking on the export menu as shown below:
3) Diagnosing Blocking Historically
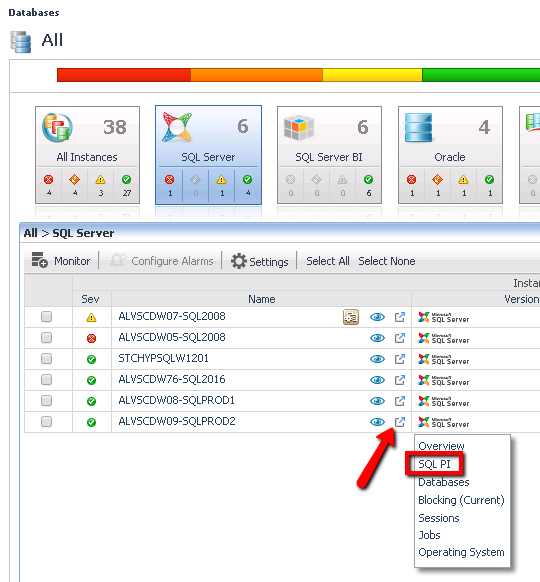
If the blocking lock scenario you are diagnosing is no longer occurring, you can still view it's full details in Foglight. You would diagnose this (along with any other historical query performance related issue) in the SQL PI drilldown. This drilldown can be found in the menu of drilldowns at the top of the Foglight for SQL Server console when looking at a particular SQL Server instance, and can also be found in the list of "quick links" from the databases global view as shown below:
Once in the drilldown, you will see a "blocking history" tab in the middle of the screen. If this tab is not shown in your console, make sure that you have the "History" tab selected at the top of the PI drilldown:
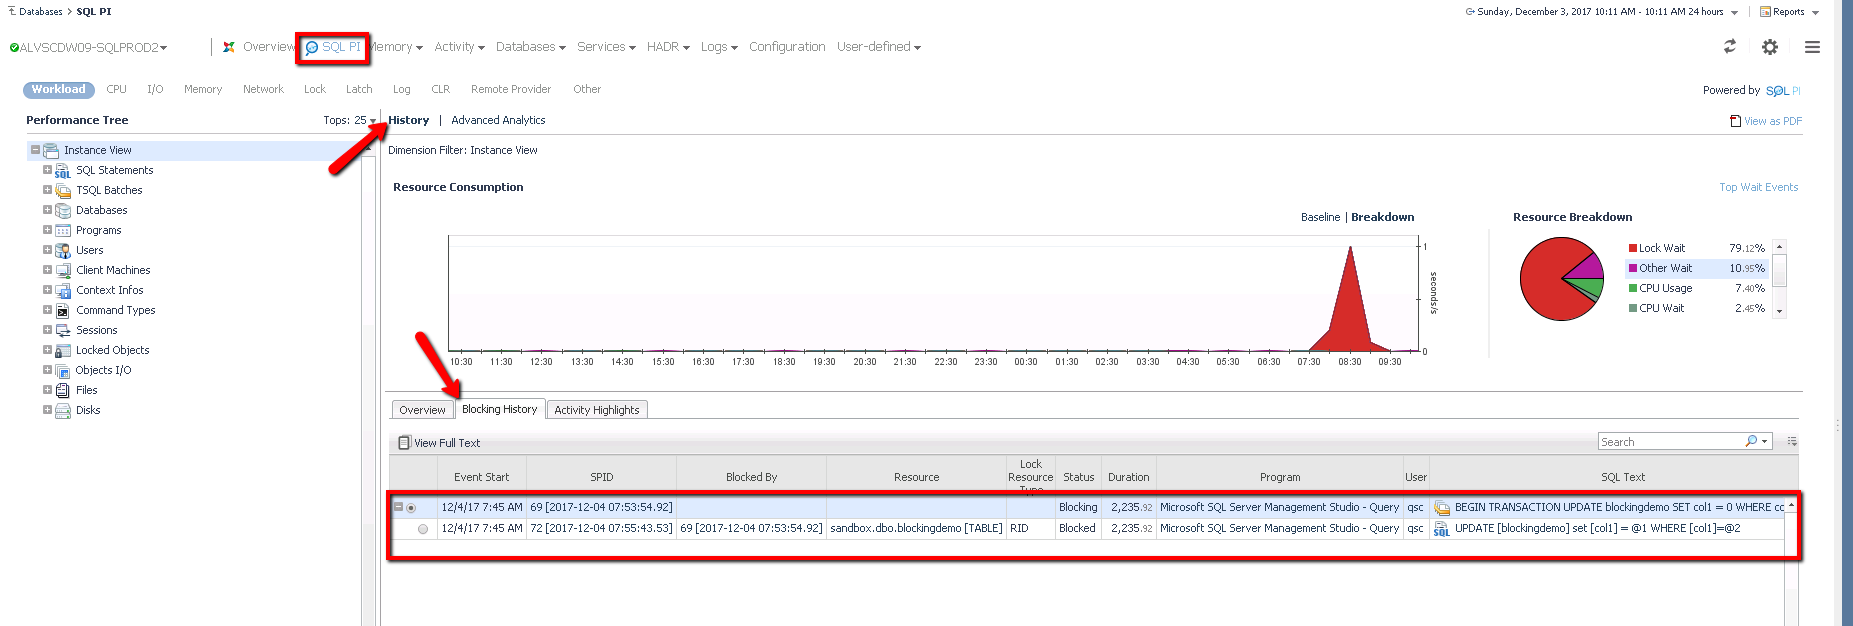
You will see in the example above that the full blocking tree is shown, including the sessions involved, start time, duration, and queries that are running. This blocking tree can be exported using the same process as shown in the real time example presented earlier in this post.
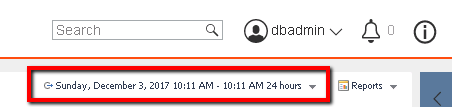
The Foglight historical time frame defaults to the last 1 hour of time. If you would like to broaden or change this time frame, you can do so using the time range selector at the top of the console:
That's all there is to it! If anyone has any questions, or would like to dig deeper on this topic, please leave a comment!
----------------------------------------------------------------------------------------------
Appendix: How to generate blocking activity on a demo instance.
- Open a connection in SSMS to the instance you wish to generate blocking against.
- Select the database you wish to create blocking against.
- In a query editor tab, create a table using the following script:
CREATE TABLE blockingdemo
- After the table is created, run the following statement in the same query window:
USE blockingdemoBEGIN TRANSACTIONINSERT INTO blockingdemo VALUES (1)UPDATE blockingdemo SET col1 = 0 WHERE col1 = 1
- In a second query editor tab, run the following command
USE blockingdemoUPDATE blockingdemo SET col1 = 1 WHERE col1 = 0
That should do it!
