
Every day we see technologies evolve and we are requiring to handle more data and tasks, this applies to multiple services and data pipelines that maintain them. Whilst we adapt to fast changing environments, it's important to monitor them and setup a strong observability system which is crucial to manage Cost, Performance, and Accuracy of your data pipelines.
An example of how data pipelines may look like: Really? 
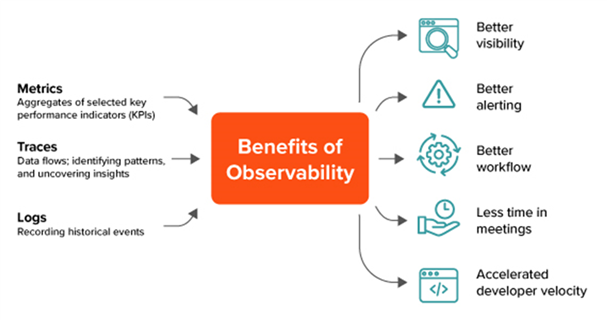
Why observability? Why is Foglight evolving as a Intelligent Data Platform?
Observability refers to how closely a system’s external output reflects the performance of its internal components and processes. It is a measure of how accurately you can judge the internal state and health of a system from externally visible clues. When you think of your databases, applications, middleware and networks as systems, observability is the measure of how readily you can ask and answer questions about them. To learn more - https://www.quest.com/learn/what-is-observability.aspx
In this blog post, I would like to show Foglight Observability data extract, this could benefit multiple use cases – potentially co-joining data from multiple tools, creating intelligent data models to enhance business and individual team’s needs so that you are able to make accelerated decisions.
So What are the tools?
In this blog post, I am using free/open source tools like Prometheus and Grafana. (Note: There are other tools that you can use for this purpose). In this example Prometheus will collect metrics and Grafana will be used to visualize, build dashboards.
What’s the setup like?
It is not as complex as it seems in the Data Pipelines image above – it’s a very simple data flow as shown below. There are only 3 main steps in this configuration to extract data from Foglight to Prometheus to Grafana.
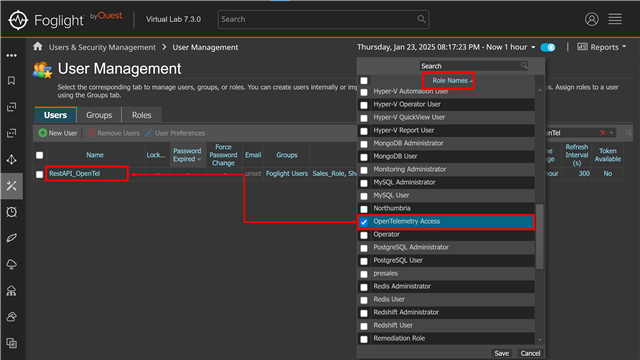
Step 1: Setting up user in Foglight
As discussed in my previous blog on Foglight’s Open Telemetry , we currently use Rest API to expose Open Telemetry metrics of Database Global View and Query Insights metrics. RestAPI is not accessible by default but is authorised by a new "OpenTelemetry Access" role. So, simply create an internal user (https://docs.foglight.com/7.3.0/integratingfoglight/opentelemetry/#creating-a-user-and-authentication-token), provide “OpenTelemetry Access” role and assign an auth token. Once you have the token, this can specified in the URL header or query parameter (for eg: https://<FOGLIGHT_HOST_NAME>:<FOGLIGHT_PORT>/api/v1/open-telemetry/metrics?Auth-Token=........)
Step 2: Prometheus Setup -
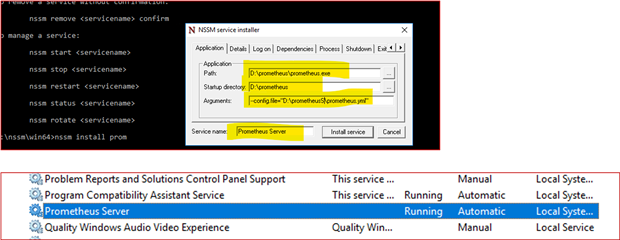
As you all may know, Prometheus is a pull-based metrics collector – where you will have to configure prometheus.yml file to scrape metric data from Foglight. I took simple steps like installing Prometheus server on a windows machine, I had to create Prometheus Service (using few old techniques) – created service uing NSSM tool or any other mechanism you may prefer. Once you start the Prometheus service, the web interface runs on its default port 9090.
To setup a Foglight job, simply edit prometheus.yml file – you will have to set the following basic fields eg: scrape_interval, job_name, targets, params for auth-token. Once the config is in place, save the file and simply restart Prometheus server service.
Example below shows configuration for Foglight within “prometheus.yml”
global:
  scrape_interval: 30s
scrape_configs:
  - job_name: foglight_telemetry
    scrape_interval: 60s
    scheme: https
    static_configs:
      - targets: ['foglight.demobox.com']
    metrics_path: /api/v1/open-telemetry/metrics
    params:
      'Auth-Token': ['00xxxXXXX46:dexxxxx12a8xXXXXXXXe5']
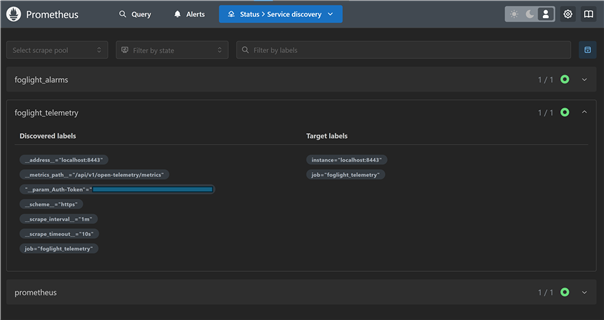
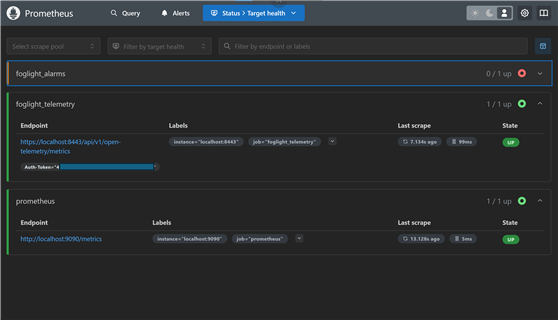
Test your configuration by going http://prometheus_server:9090/service-discovery and http://prometheus_server:9090/targets – the status should be up. If you notice any issues, check your yml config again.
Step 3: Setting up Grafana
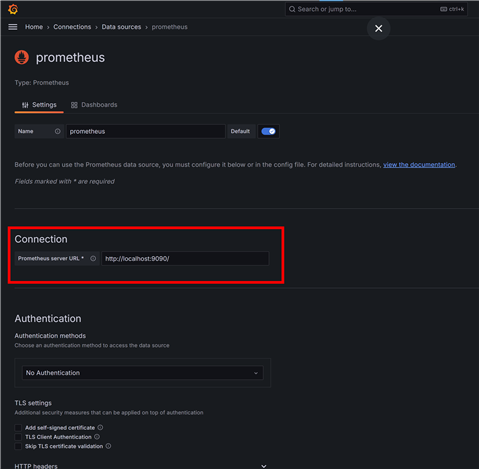
With Grafana you can create, explore, and share all of your data through flexible dashboards. The steps are quite simple – Once you install Grafana (in my case windows) – it creates a service and Grafana runs on port 3000. Test the URL http://graffanahost:3000/ and login using its default admin account. Once you are in, as a first step, add Prometheus as a datasource – http://hostname:9090/, start building dashboards for Foglight Metrics,
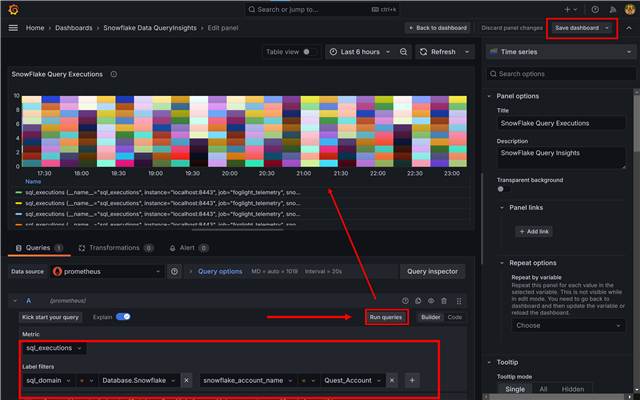
Find metrics using "metrics explorer" | select a metric | Test and run query eg: “SQL_EXECUTIONS” to preview a graph, add to your dashboard and save – Continue to add more metrics to your dashboard
If you would like to learn more about building dashboards on Grafana, here is the link https://grafana.com/docs/grafana/latest/getting-started/build-first-dashboard/
Example Dashboards showing Foglight Metrics
I like to share the dashboards from my test lab, where I have used Snowflake and PostgreSQL Observability metrics export to build Grafana dashboards (Examples below)
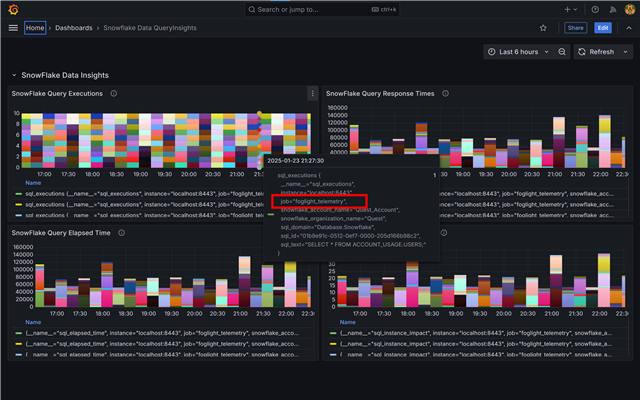
Snowflake Query Insights
This dashboard represents SQL Executions, Response Time, Elapsed time and SQL Instance Impact metrics – I am using histogram view with table views at the bottom. Hovering over graphs gives further insights on query text, SQL ID etc.
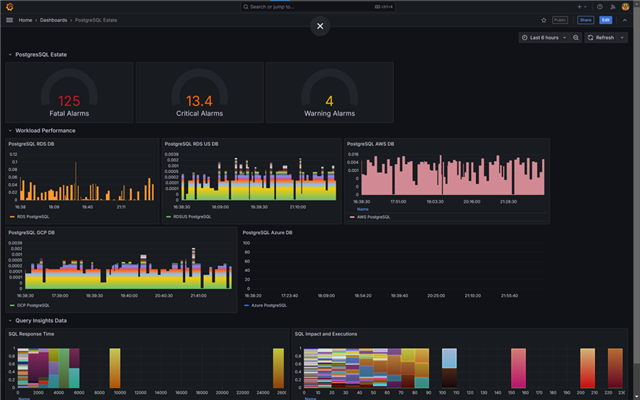
PostgreSQL Estate – Database Workload Performance, Query Insights and Database Alarms
This dashboard represents a mix of PostgreSQL DB running on AWS, Azure and GCP showing Alarms for my PostgreSQL DB estate, Workload Performance on each database and query response, impact and executions.
To conclude, Foglight’s OpenTelemetry has been enhanced to offer greater flexibility, allowing users to integrate various tools seamlessly. This means you can choose from a wide range of third-party or open-source tools to analyze and visualize data metrics from Foglight Observability, making it easier to monitor and optimize your systems. This adaptability helps in customizing your monitoring setup to better meet your specific needs and preferences.

