

Many of our Foglight customers have begun innovating newer applications that require storage of massive amounts of data but remain flexible in terms of its data structure. Cassandra is a NoSQL database platform that offers scalability and high availability without compromising on commodity hardware or cloud infrastructure. This has made Cassandra an idea platform for customers that want the ability to replicate mission-critical data across multiple datacenters while keeping latency low and data highly available through architecture rigidity.
Foglight for Cassandra is a cartridge that can be installed into an existing Foglight Management Server to provide a consolidated view of all monitored Cassandra Clusters containing information about the cluster structure, nodes, health status and other key metrics. The business challenges many of our customers face revolves around effectively supporting large amounts of data processing, but an expanding cluster can introduce complexity in the supporting data infrastructure. Understanding the performance of Cassandra clusters is crucial for diagnosing issues and planning capacity.
For those of you looking to get started with Foglight for Cassandra please ensure that Apache Versions 2.1+ and DataStax Enterprise (DSE) Versions 4.8+ are used as they are compatible from a monitoring perspective. This Foglight 101 Webcast I delivered back in late 2019 provides a closer look at requirements for using Foglight for Cassandra including:
- Cassandra Database Provisioning - how Foglight gains access into cataloged metrics in the system keyspace
- Cassandra JMX Configuration - how Foglight gains access to important metrics in Cassandra which are exposed through Java Management Extensions
- Setting up your first Foglight monitoring connection
- Troubleshooting connectivity
- Best practices and essential first steps using the Foglight Cartridge for Cassandra
Now that you have the information you need to configure the monitoring of a Cassandra Cluster via Foglight, you will need some information that will help you navigate through the solution as you gain more exposure and experience. This video on YouTube illustrates how to navigate what I believe are the top 3 use-cases for monitoring Cassandra clusters with Foglight. These use-cases include monitoring for:
- Latency for Reads/Writes
- Uneven Data Distribution
- Slow nodes bringing down your cluster
Just for good measure though, here are some quick tips on navigating Foglight's web console after you've setup your first Cassandra Cluster for monitoring. And remember, for more information on Foglight for Cross Platform Databases you can visit this page for the latest and greatest resources.
Quick Tip 1 - Drilling into a monitored Cassandra Cluster. In Figure 1 below, you will see the cluster named "demoCluster" listed in in the Databases home page in the Foglight Web Console. When you select the cluster name, it will drill you into the "Nodes Table" (see Figure 2) which can be used for a quick at-a-glance overview of each node in the cluster. More information on assessing the balance across nodes is featured in my aforementioned video. From here you can also click on the "Topology View" (see Figure 3), which illustrates a diagram of the monitored Cassandra Cluster including the datacenter, racks and nodes as well as their alarm state.
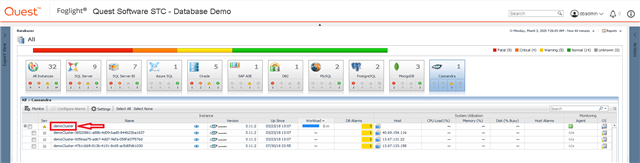
Figure 1 - Drilling into a monitored Cassandra Cluster
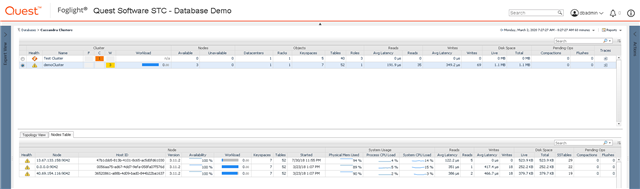
Figure 2 - Nodes table for a selected Cassandra Cluster
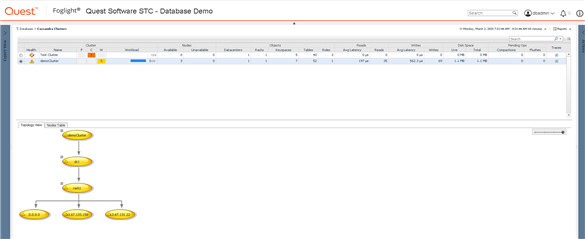
Figure 3 - Topology view for a selected Cassandra Cluster
Quick Tip 2 - Working with the out of the box Cassandra dashboards. Over on the left hand side of Foglight, you will see a Navigation pane. This pane will include an expandable tree called "Dashboards" where you will be able to expand on the sub-dimension called "Cassandra". Each of these requires the use of the "Cluster Selector" (see Figure 4) which is available on the right-side margin of Foglight called "Actions". This will help the user toggle the cluster selected which drives what data is being shown in the dashboards. Foglight comes equipped with four main out of the box main dashboards for Cassandra which include:
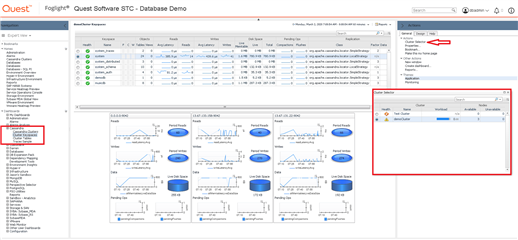
Figure 4 - Cluster Selector
- Cassandra Clusters - which provides the node and topology overviews for the selected clusters
- Cluster Keyspaces - which provides latency, capacity pending operations and replication metrics for a keyspace across the cluster.
- Cluster Tables - which provides # of indexes/views, read/write latency cache hit, capacity and pending operations for a table across the cluster
- Traces Sample - which provides the Cassandra administrator the opportunity to enable tracing through Foglight on a portion of all queries using nodetool settraceprobability
Quick Tip 3 - Alarms and threshold administration: You will notice that several alarms will be firing and visible within different dashboards in Foglight; namely the Databases homepage. You may have tried to select the cluster you were interested in and "Configure Alarms". Unfortunately, you will get a popup message (see Figure 5) that will indicate that the Cassandra agent is not supported for rules/alert administration via this dashboard. What you will need to do instead is venture over to the Navigation panel on the left, expand on "Administration" and then expand on "Rules and Notifications" (see Figure 6). From here you can select "Rules", then make sure that the "CassandraAgent" is selected in the cartridge listbox above (see Figure 6). From the Rules dashboard you can review and edit threshold values for the out of the box rules built into Foglight's Cartridge for Cassandra.
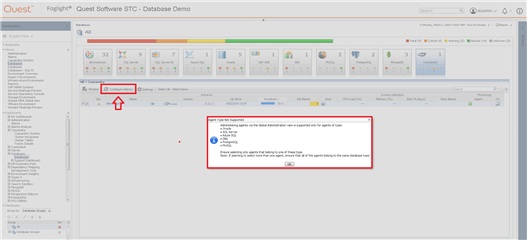
Figure 5 - Alarms warning message from Databases Home Page
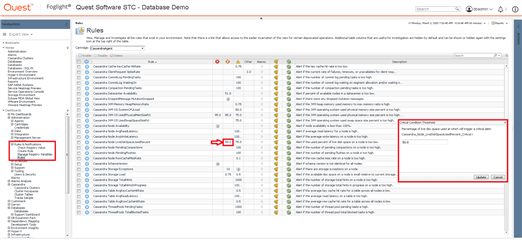
Figure 6 - Foglight rules administration dashboard for Cassandra alerts