
Foglight offers the capability to use scripts to build monitoring agents for any purpose. This blog describes a custom agent to monitor Informix instances. Please understand this cartridge as an example and template that can be customized and improved. It is not supported by Quest! This agent was built by using the Foglight cartridge builder. Please refer to the information found in the following link for how to use the cartridge builder.
To get information about how to create a custom script agent in Foglight, please follow the information under the following link:
https://www.quest.com/community/foglight/w/administrators/219/custom-script-agent-1-leverage-an-existing-monitoring-script-to-push-data-into-foglight
Agent prerequisites
The agent in this example has the following limitations and prerequisites:
- Supports Informix installations on Linux and Unix operating systems.
- No remote monitoring. A Foglight Agent Manager must be running on the monitored system.
- The scripts will create buffer files to prepare the monitoring results. These files will be placed in the /tmp directory. This directory must exist and be accessible by the user that runs the agent manager.
- The scripts will use Korn shell. This must be installed.
The agent works with a set of shell scripts executing SQL statements to collect information, preparing the data and inserting it into Foglight. The following list describes the purpose of each script:
informix_main
This script calls all other scripts one after the other. It gets the ASP parameter $informixenv with the path and the file to set the Informix environment. In the Foglight Cartridge Builder this is the “Main Command” script.
informix_logs
Gets the number of logical logs and status.
informix_dbs_size
Gets the size of DBSpaces.
informix_dbspaces_free
Gets the free space in DBSpaces in percentage.
informix_extents
Number of extents per table.
informix_locks_owner
Number of exclusive locks per user.
informix_locks_table
Number of exclusive locks on a table.
informix_locks_wait
Number of waiters on locks.
informix_log_user
Number of pages in the transaction log for a user.
informix_transactions
Information about long-running transactions.
informix_mode_s
Status of the instance: OFF, Quiescent, SingleUser, Online.
informix_buffer
Gets the CacheRate per buffer pool.
informix_connections
Number of connections per user.
The scripts can be used as a template for extensions. Here the example for the collection of buffer information “Informix_buffer”:
!/bin/ksh
#####################################################
# Run the sql query against the selected database #
# The only modification needed for this procedure #
# is the sql command itself. This is written in #
# standard INFORMIX SQL #
#####################################################
#Setting the Informix Environment using the ASP and executing the SQL
. $1
export DBMONEY=.
filext="_$INFORMIXSERVER"
run_sql()
{
dbaccess sysmaster 2>/dev/null << !!
unload to /tmp/ifx_buffer$filext.lst
delimiter " "
select
'Buffsize'||bufsize::char(12) as queue_name,
trunc((1-(dskreads/bufreads))*100,4) as read_cache,
case
when trunc((1-(dskreads/bufreads))*100,4) > 95 then "OK"
when trunc((1-(dskreads/bufreads))*100,4) > 90 then "WARN"
else "LOW"
end as flag
from sysbufpool
where bufreads > 0
--and bufsize=2048
!!
}
#######################################################
# Clean up the output from sql #
#######################################################
remove_blank_lines()
{
sed '/rows selected/d' /tmp/ifx_buffer"$filext".lst > /tmp/ifx_buffer"$filext".r.lst
sed '/^$/d' /tmp/ifx_buffer"$filext".r.lst > /tmp/ifx_buffer"$filext".d.lst
}
######################################################
# Remove the temp files #
######################################################
clean_up()
{
rm -rf /tmp/ifx_buffer"$filext".lst
rm -rf /tmp/ifx_buffer"$filext".d.lst
rm -rf /tmp/ifx_buffer"$filext".r.lst
}
#export debug=1 #uncomment this line for extra debugging information
export debug=0 #uncomment this line to remove extra debugging
run_sql
remove_blank_lines
# If debug is set, send extra information to the agent log as seen in the FOC
if [ $debug == '1' ]
then
echo LOG Debugging is switched on
fi
# Inserting the collected data in a Foglight table
wc -l /tmp/ifx_buffer"$filext".d.lst | read line_count line_tmp
if [ $line_count != '0' ]
then
echo TABLE IFXBuffer
# This section will have to be modified depending on the sql statement.
# The number of variables read must equal the number of fields received from
# the sql statement and also must equal the number of fields in the Foglight table
while read queue_name read_cache flag
do
echo START_SAMPLE_PERIOD
echo queueName.String.id = $queue_name
echo readCache:percent = $read_cache
echo flag.StringObservation.obs = $flag
echo END_SAMPLE_PERIOD
done < /tmp/ifx_buffer"$filext".d.lst
echo END_TABLE
fi
#clean_up
exit 0
Rules
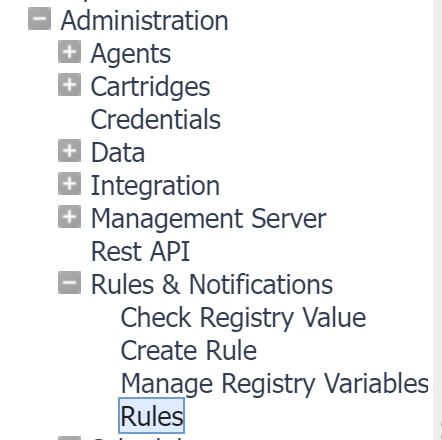
The Informix cartridge contains already some preconfigured rules to create alarms. The rules can be found under /Administration/Rules&Notifications/Rules
After the agent is installed you can use the rules dashboard with the filter “Informix” to see the predefined rules.
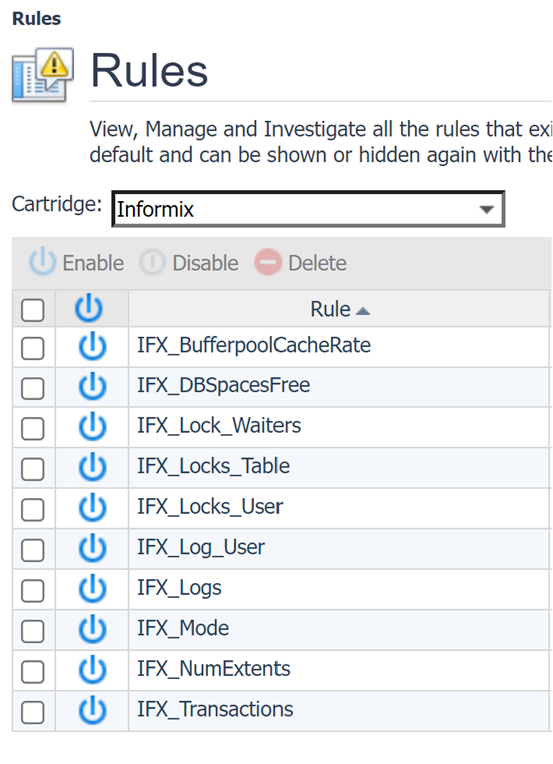
All rules have only the severity “critical” configured and activated. These rules can be adjusted to individual needs.
Name and pre-configuration of the rules:
IFX_BufferpoolCacheRate
Bufferpool CacheRate. Alarm if under 90
IFX_DBSpacesFree
Free space of DBSpaces in percent. Alarm if under 20
IFX_Lock_Waiters
Number of waiters on locks. Alarm if over 10
IFX_Locks_Table
Number of exclusive locks on a table. Alarm if over 1000
IFX_Locks_User
Number of exclusive locks of a user. Alarm if over 1000
IFX_Log_User
Number of pages in the transaction log per User. Alarm if over 1000
IFX_Logs
Number of logs with status Backuped/New/Use_Not_Backuped/Dropped/Current. Alarm if over 5 and status use_not_backuped
IFX_Mode
Status of the instance: OFF, Quiescent, SingleUser, Online. Alarm if not Online
IFX_NumExtents
Number of extents per table. Alarm if over 60
IFX_Transactions
Long transactions. Alarm if over 10 (logs, spanned by a transaction)
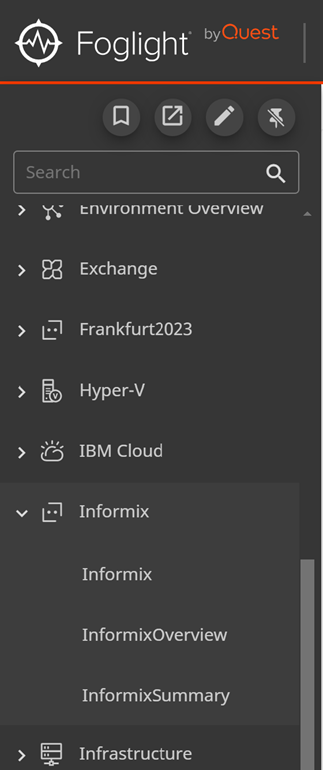
Dashboards and views
This cartridge version offers two similar dashboards that show the general alarm status of Informix instances and predefined views that can be used to build individual drag and drop dashboards in the classic view of the Foglight GUI. The Informix Overview Dashboard and the Informix Summary Dashboard are just examples included in the cartridge.
Informix Overview Dashboard

Name of the Informix agent, number of alarms per severity, the host name and the agent status. A click on a row opens the Foglight Alarms Dashboard.
Informix Summary Dashboard

Similar to the Overview dashboard. It also shows the Informix server name and the mode of the instance.
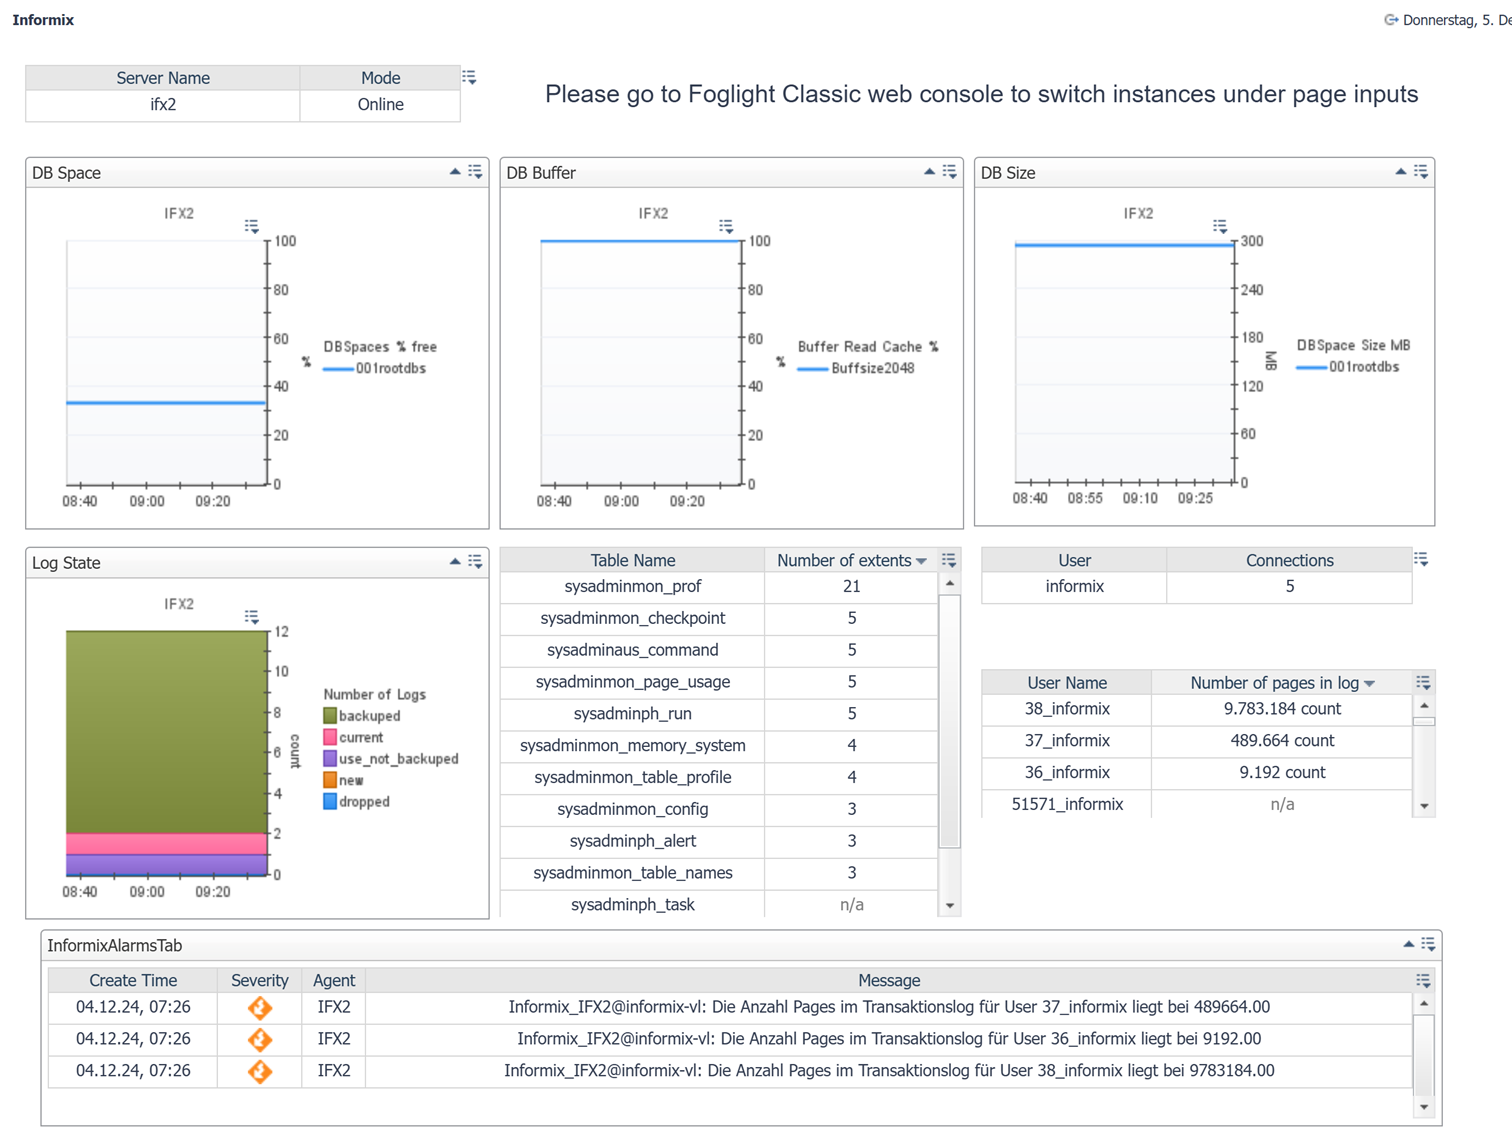
Building a drag and drop dashboard
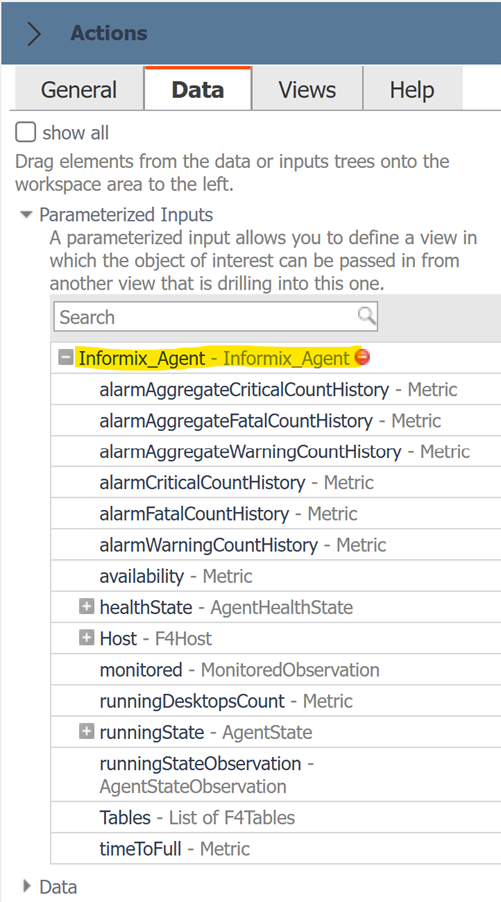
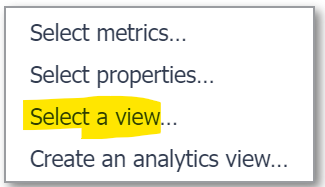
As there are limitations for the creation of drag and drop dashboards using a custom script agent, the cartridge offers predefined views that can be used. There is a tabular and graphical view available for every collected metric. Especially for dashboards with parameterized inputs which do not offer direct access to the tables created by the agent. If using the parameterized inputs option just drag and drop “Informix_Agent” to the dashboard page and choose from the available views.
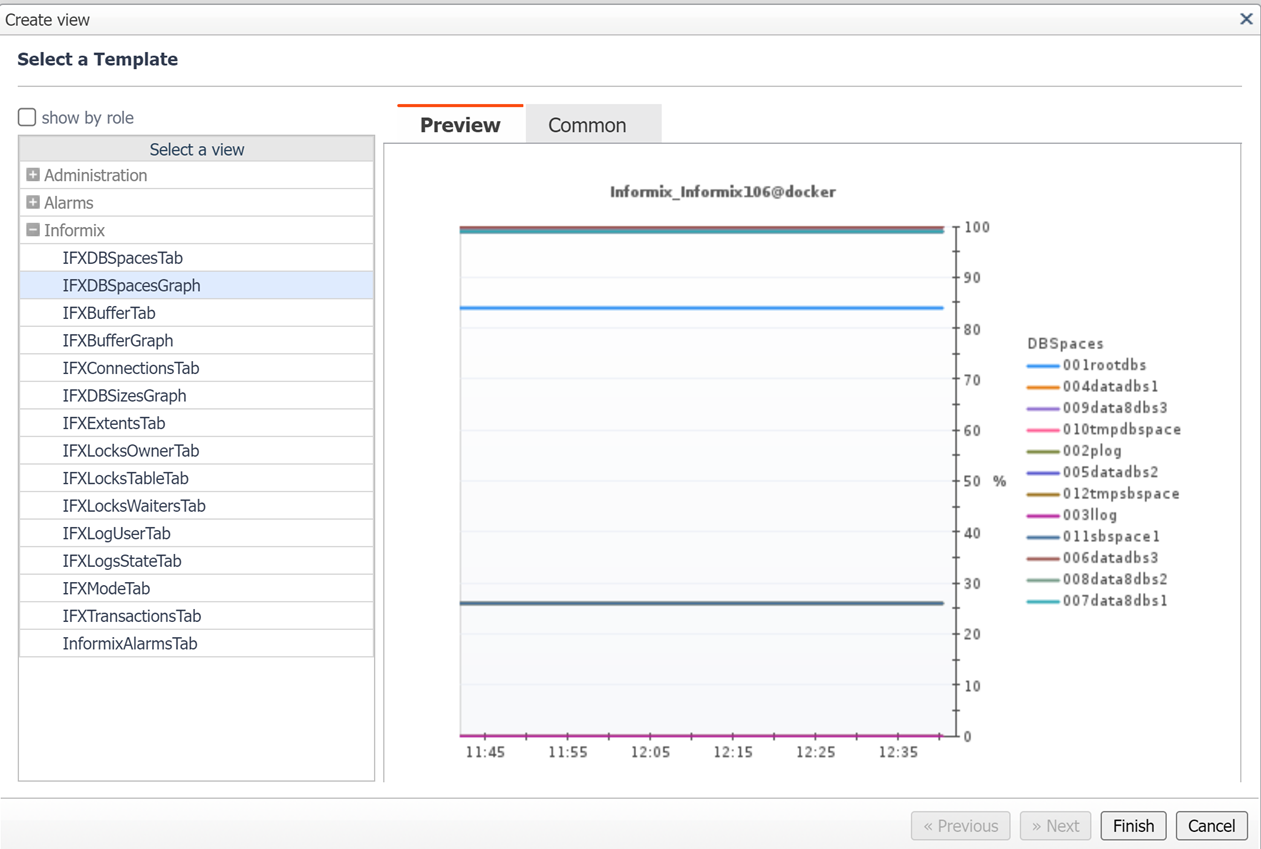
A drag and drop dashboard might then look like this using the predefined views.
Setting up the agent
The cartridge itself can be installed like every other cartridge using the “Install Cartridge” option in the cartridge inventory dashboard using the Foglight administration menu.
The next step is to deploy the “Informix_Installer_default” package to the Foglight Agent Manager where the agent is required to run. Please remember, as the cartridge does not support remote monitoring, the agent manager must run on the Informix box locally.
After the successful deployment we can create an Informix agent
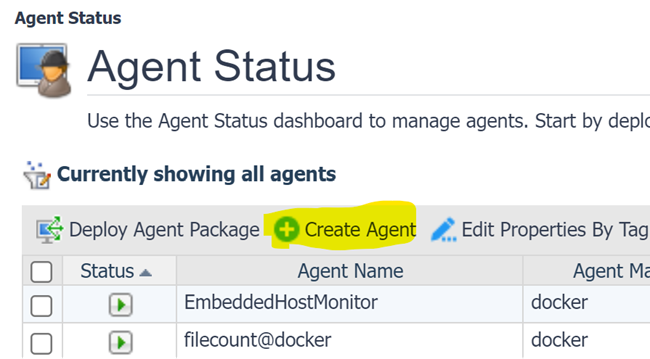
- In the Foglight console go to /Administration/Agents/Agent Status
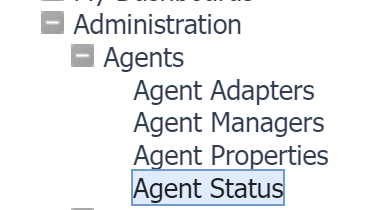
- Click „Create Agent“ in the dashboard
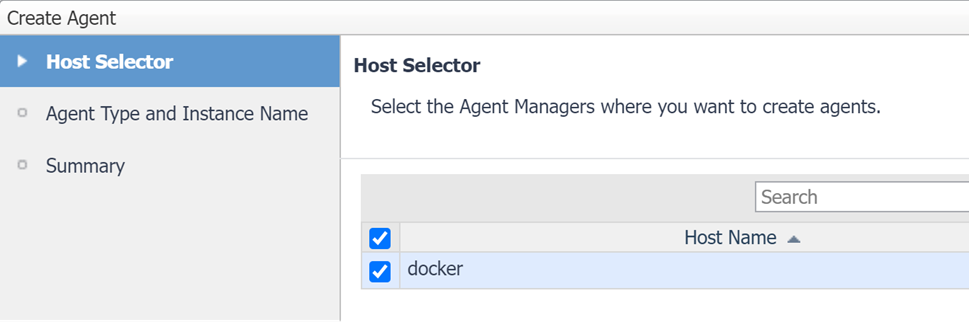
- In the dialog “Host Selector” pick the agent manager to which the package was deployed before.
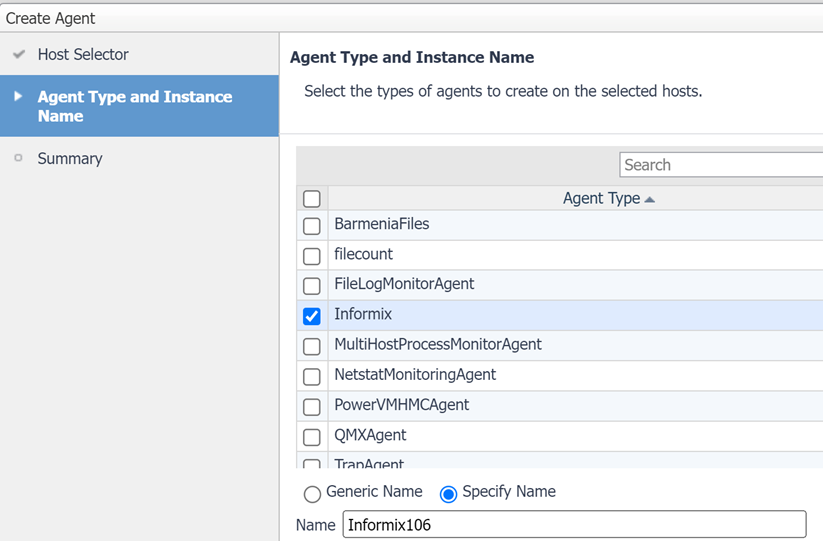
- Check agent type “Informix” and give the agent a meaningful name.
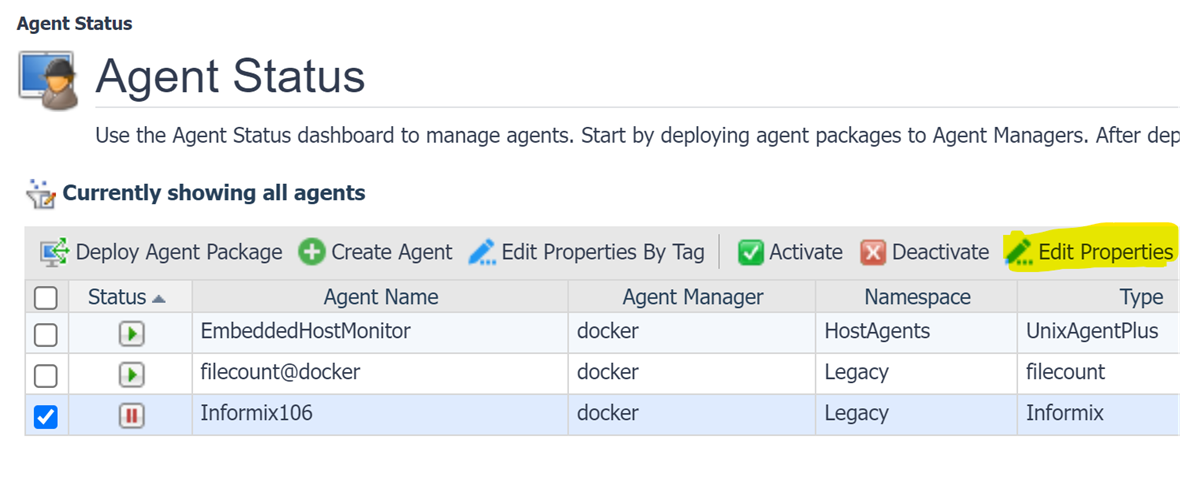
- The agent will now show up in the agent status dashboard. Please check the agent and click on “Edit Properties”.
- Click „Modify the private properties for this agent”
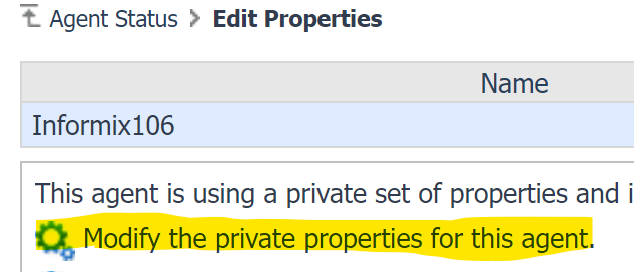
-
Set the two properties.
“Informix Environment”: the complete path with the executable file to set the Informix environment created during the setup of an Informix instance. The configuration file contains the following information and should look like this example:INFORMIXDIR=/opt/Informix
INFORMIXSERVER=ol_informix1510
ONCONFIG=onconfig.ol_informix1510
INFORMIXSQLHOSTS=/opt/Informix/etc/sqlhosts.ol_informix1510
GL_USEGLU=1
PATH=${INFORMIXDIR}/bin:${INFORMIXDIR}/extend/krakatoa/jre/bin:${PATH}
export INFORMIXDIR INFORMIXSERVER ONCONFIG INFORMIXSQLHOSTS GL_USEGLU PATH
“Collection Frequency”: the time interval when the agent should collect data in seconds. The default is 60. A value > 240 is recommended!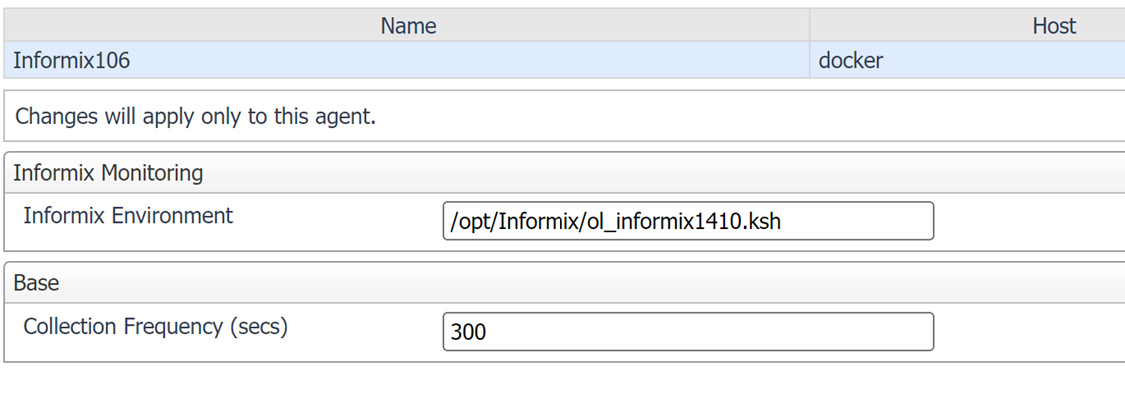
Click save.
Activate the agent in the “Agent Status” dashboard. If successful, the collection status should be visible in the dashboards under Informix in the Foglight menu tree.
Attached you will find a ZIP file containing the scripts used for this build and the cartridge file.
