In this first of a series of technical articles, Quest Principal Solutions Architect Brian Wheeldon steps through the process of building a script agent using best practices. This agent calls an existing monitoring script, formats the output, and publishes data into Foglight. He then configures a Foglight rule to generate an alert if there is a problem.
Monitoring Script
Most IT groups have a library of scripts that they use to collect information about their environment.
These scripts may be written in batch, shell, perl, SQL, Java or even Groovy but they all have a common purpose - to compile useful information about the IT infrastructure. These scripts may be ad hoc informal scripts written by administrators to execute on demand from the command line, or they may be part of a more formal monitoring practice. A Foglight Community member pointed out that "there are thousands of agents available for Nagios [and] more every day".
What if you could leverage these existing scripts to push data into Foglight?
Today I'd like to step through an example of doing that so that you can build something similar for your domain.
I ran an internet search and found a useful plugin for monitoring TCP ports at http://exchange.nagios.org/directory/Plugins/Operating-Systems/Windows-NRPE/check_tcp/details. This example runs on Windows so it's easy to test on a desktop and can easily be deployed on a server.
You can run check_tcp.exe from the command line with parameters representing the target host, port, warning and critical thresholds:
check_tcp.exe -H -p -w -c
The utility will return a message indicating the success/failure of the connection, the response time, and an indication if the response time exceeded the specified thresholds in milliseconds.
For example:
>check_tcp -H 23.21.117.44 -p 8080 -w 100 -c 200
TCP OK - 0.018 second response time on port 8080 |time=0.018177s
Create a Wrapping Script Agent
To get this information into Foglight, create a simple script agent that executes check_tcp.exe and writes the result in a structured format so that Foglight stores it in the model where it can be accessed by rules, dashboards, reports, derived metrics etc.
The script should write to stdout something like this:
TABLE TCP_CHECK
START_SAMPLE_PERIOD
hostname.String.id=23.21.117.44
port.String.id=8080
message.StringObservation.obs=TCP OK - 0.021 second response time on port 8080 time+0.021043s
END_SAMPLE_PERIOD
END_TABLE
The lines with START and END are foglight script agent format commands that begin and end the collection. The TABLE TCP_CHECK line specifies the name of the table where this information will be stored in the Foglight model.
The two lines with "id" specify the identity properties of this table. These are the host and port properties that uniquely identify this monitored instance.
The "message" line will be reported to the FMS each time the script is executed. It matches the check_tcp.exe output with a couple of string substitutions to facilitate processing and avoid parsing errors.
For more information about creating script agents, see
Custom Agents – Introduction to Script Agents
Custom Agents - Script Agent Data Modeling and Units
Best Practice: Design the properties and metrics of your agent carefully before you start implementing. Be sure that you understand the difference between properties and metrics. You'll get to the finish line faster if you make it right the first time. Select meaningful property and metric names. Select accurate unit names for metrics so that Foglight can automatically scale them for display.
Whenever I start working with Windows batch scripts I usually regret it because of the odd syntax. But after a few internet searches and some trial and error, this is the script that wraps check_tcp.exe and formats the output for Foglight. The comments explain what each part of the script does.
| tcp_check.bat |
|---|
|
@echo off @rem This Foglight script agent leverages a check_tcp monitoring .exe for Windows from @rem http://exchange.nagios.org/directory/Plugins/Operating-Systems/Windows-NRPE/check_tcp/details @rem The script tests TCP connections to the specified host and port. @rem It also monitors the time to connect with warning and critical levels. @rem The script comes with no support, expressed or implied. @rem set target host, port, warning threshold (ms) and critical threshold (ms) set _hostname=23.21.117.44 set _port=8080 set _warning=100 set _critical=200 @rem build command line set _check_tcp=check_tcp -H %_hostname% -p %_port% -w %_warning% -c %_critical% @rem set _expected="TCP OK - 0.018 second response time on port 8080 |time=0.018177s" @rem execute the command line and collect the output into a variable without '|' FOR /F "tokens=1,2 delims=^|" %%i IN ('%_check_tcp%') DO SET _result=%%i%%j @rem replace '=' to avoid a StringObservation parse error FOR /F "tokens=1,2 delims=(=" %%A IN ("%_result%") DO SET _result1=%%A+%%B @rem output the results in script agent format echo TABLE TCP_CHECK echo START_SAMPLE_PERIOD echo hostname.String.id=%_hostname% echo port.String.id=%_port% echo message.StringObservation.obs=%_result1% echo END_SAMPLE_PERIOD echo END_TABLE |
Before saving this script, modify the hostname and port values according to your monitoring target. If you need a target for testing purposes, you can use the FMS host. The FMS listens on ports 1098, 1099, 4444, 4445, 4448, 8080 and 8443 by default.
Deploy the custom agent
To deploy this script agent in foglight, collect the two files "check_tcp.exe" and "tcp_check.bat" into a Zip file called tcp_check.zip. The name of the zip file is important because when Foglight extracts tcp_check.zip, it will look for a file called "tcp_check" to execute. This agent zip file can be installed on the FMS (Foglight Management Server) from the "Script Agent Builder" dashboard in Adminstration/Tooling. A copy of tcp_check.zip is attached to this document.
Best Practice: Where feasible, include all the supporting files required by your agent, including monitoring scripts, configuration files, library files etc. with your script agent in a properly named Zip file so that Foglight can deploy all the necessary artifacts on the target host. Depending on these artifacts to be separately installed in a consistent location on all agent hosts is error prone and makes your agent more difficult to maintain and support.
Best Practice: Experiment with new agents, configurations, dashboards and reports on a staging or test FMS; don't deploy an untested agent or develop new artifacts on a Production FMS where a mistake can be costly.
Configure the agent
Once installed, you can deploy it to one or more hosts from the Agent Hosts or Agent Status dashboards. Create an instance of the agent. Optionally configure the frequency of collection by editing the agent properties. Activate the agent.
After creating the agent and activating it, you can update the host and port to monitor.
On the machine where the FglAM (Foglight Agent Manager) hosting the agent is running, you will find the script in:
%FGLAM_HOME%\state\default\agents\tcp_check\<version>\script\tcp_check.bat
Validate the agent data
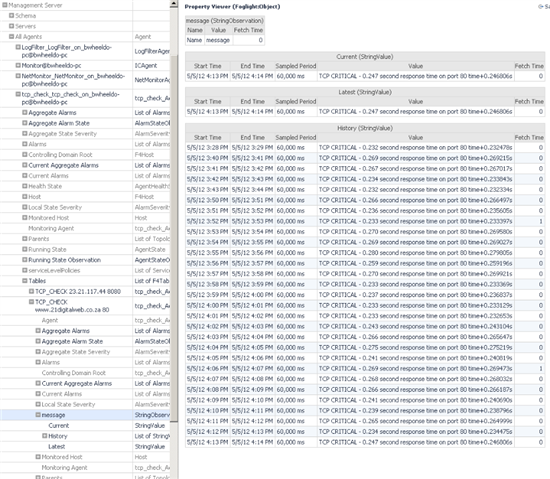
You should see the custom agent data appear in the Foglight Data browser (under Configuration) within a few minutes.
Open the tree to expose:
Management Server/All Agents/<tcp_check_agent_name>/tables/TCP_CHECK table
Best Practice: Use the Data viewer to validate the existance and quality of data in the Foglight model. Select the Property Viewer from the right action panel in the General tab to see the raw, technical attributes of the topology object you select in the left panel.
Create a rule to alert if the TCP connection is unavailable or slow
Now that the raw data is in Foglight, we can begin leveraging Foglight's capabilities to convert this information into useful knowledge.Start by creating a rule to alert if the TCP connection is slow or unavailable.
Rule Definition
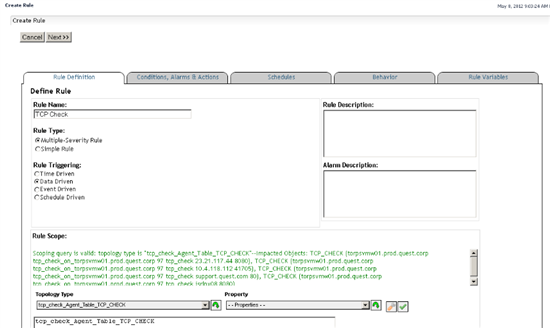
Go to Administration/Rules & Notifications/Create Rule and specify the neme of the rule:
Select Multiple-Severity Rule because the check_tcp script returns "WARNING" or "CRITICAL" conditions.
Use "Data-Driven" (the default) so the rule is evaluated every time new data arrives in the FMS.
Set the rule scope to the topology type of the table created the the tcp_check agent. If you click on the drop down arrow and type "tcp", the combobox will display the custom script agent types. Select "tcp_check_Agent_Table_TCP_CHECK" and click on the green 'down' arrow beside the combo box to choose that type.
Best Practice: Always validate the rule scope by clicking on the green 'check mark' button at the right of the selection row. If the scope is valid, you will see a confirming message and a list of objects to which the rule applies.
Rule Variables
When you click "Next" the Wizard will take you to the "Conditions, Alarms & Actions" tab. I usually want to define some variables that I can use in all the actions and conditions, so I prefer to use the Rule Variables tab next.
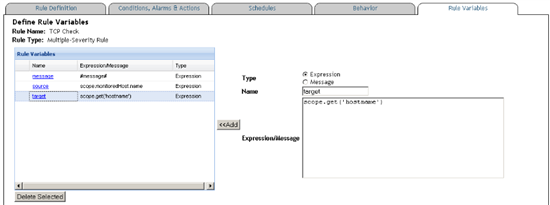
Add these three expressions in the Rule Variables tab:
message=#message#
source=scope.monitoredHost.name
target=scope.get('hostname')
Once defined, use these shortcuts in the rule message and actions across all severities:
@message is the most recent message from the agent. e.g. "TCP OK - 0.021 second response time on port 8080 time+0.021043s"
@source is the name of the host where the TCP agent is connecting from
@target is the device the agent is attempting to make a TCP connection to
Best Practice: Define Rule Variables to collect values to use across all rule severities and actions. Choose meaningful variable names so that these parameters are easy to read and understand.
Rule Conditions
Next, go the the Conditions, Alarms & Actions tab to define the Warning and Critical alert conditions.
Open the Warning box and enter this condition:
#message#.contains('WARNING')
Set the Alarm Message to leverage the Rule Variables you just defined:
TCP Check Warning: @source to @target @message
Click on the green checkmark button to validate the condition.
Assuming you see "Success: Valid condition", check "Activate".
Open the Critical box.
Click on "Copy condition/alarm from..." and select Warning.
This populates the Critical condition with the information you just entered in the Warning condition.
In the Condition field, replace "WARNING" with "CRITICAL".
In the Alarm Message field, replace "Warning" with "Critical"
Validate the rule condition.
Check "Activate".
Best Practice: Use the Copy condition/alarm feature to save time and maintain consistency across rule conditions.
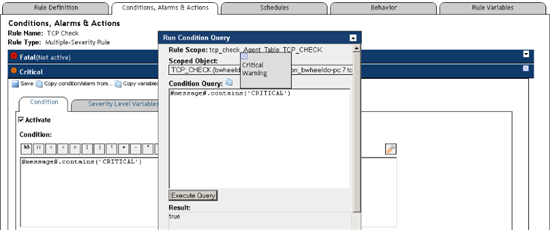
Open the Run Condition Query box, select the Scoped Object. You can choose the Warning and Critical Condition Query if these have been saved or copy/paste the condition from your rule. Press "Execute Query".
The result should be "false" or "true".
The Run Condition Query box makes it easy to validate and test experimental rule conditions.
Best Practice: Validate rule conditions before saving them. Use the Run Condition Query dialog to test each condition with current data.
You can click Next, Next, Next in the Create Rule wizard to move through the other tabs, or just click Finish to save the rule.
Test the Rule
Your rule is now being evaluated each time new script agent data arrive in the FMS. To test this rule, edit the agent script (as above) and adjust the warning or critical thresholds to low values.
Shortly after you do that, you should see a new alarm in the Alarms dashboard:
In this article, we've developed and deployed a custom script agent that leverages an existing monitoring script to push data into Foglight. We've also implemented a rule that triggers an alert when the monitored port is unavailable or slow to respond.
In the follows installments of this series, we'll be enriching this custom agent. The next step is to Build a WCF Dashboard to View the Custom Agent Data.
If you find this article useful, please Like or Rate it.
If you successfully implement the script agent attached, or better yet, use this article to implement your own monitoring script in Foglight, please comment below. Hint: If you're interested in a Unix version of the wrapped monitoring script, you can find it with a search.


