• Products
    • View all products
    • Free trials
    • Buy online
    • Product lines
      • ApexSQL
      • Change Auditor
      • Enterprise Reporter
      • Foglight Database Monitoring
      • Foglight Evolve
      • KACE
      • Metalogix
      • Migration Manager
      • NetVault Backup
      • One Identity
      • QoreStor
      • Quest On Demand
      • Rapid Recovery
      • Recovery Manager
      • RemoteScan
      • SharePlex
      • Spotlight
      • Stat
      • Toad
    • Featured products
      • Cloud Management
        • Cloud Access Manager
        • Foglight for Virtualization, Enterprise Edition
        • Identity Manager
        • On Demand Migration for Email
        • Quest On Demand
        • Rapid Recovery
      • Data Protection
        • Foglight for Virtualization
        • NetVault
        • NetVault for Office 365
        • QorePortal
        • QoreStor
        • Rapid Recovery
        • vRanger
      • Database Management
        • Foglight for Databases
        • Litespeed for SQL Server
        • SharePlex
        • Spotlight SQL Server Enterprise
        • Toad Data Point
        • Toad DevOps Toolkit
        • Toad Edge
        • Toad for Oracle
        • Toad for SQL Server
      • Identity & Access Management
        • Active Roles
        • Defender
        • Identity Manager
        • Identity Manager Data Governance
        • One Identity Safeguard
        • Password Manager
        • Privileged Access Suite for Unix
        • Starling Connect
        • Starling Two-Factor Authentication
        • syslog-ng
      • Microsoft Platform Management
        • Active Administrator
        • Change Auditor
        • Enterprise Reporter
        • GPOADmin
        • InTrust
        • Metalogix
        • Migration Manager
        • On Demand Migration for Email
        • Quest On Demand
        • Recovery Manager
      • Performance Monitoring
        • Foglight Capacity Director
        • Foglight Hybrid Cloud Manager
        • Foglight for Databases
        • Foglight for Operating Systems
        • Foglight for Oracle
        • Foglight for PostgreSQL
        • Foglight for SQL Server
        • Foglight for Storage Management
        • Foglight for Virtualization
        • Spotlight on SQL Server
      • Unified Endpoint Management
        • Desktop Authority Management Suite
        • KACE Cloud Mobile Device Manager
        • KACE Desktop Authority
        • KACE Privilege Manager
        • KACE Systems Deployment Appliance
        • KACE Systems Management Appliance
        • RemoteScan
  • Solutions
    • View all Solutions
    • Industries
      • Education
      • Energy
      • Federal Government
      • Financial Services
      • Healthcare
      • State & Local Government
    • Platforms
      • Active Directory
      • Cisco
      • DB2
      • Exchange
      • Google
      • Hyper-v
      • Lotus Notes
      • OneDrive for Business
      • Office 365
      • Oracle
      • SAP/Sybase
      • SharePoint
      • SQL Server
      • Teams
      • Unix/Linux
      • VMware
      • Windows Server
    • Cloud Management
    • Data Protection
      • Overview
      • Backup & Recovery
      • Cloud Management
      • Deduplication & Compression
      • Disaster Recovery
      • Office 365 Data Protection
      • Virtualization Management
    • Database Management
      • Overview
      • Administration
      • Cloud Migration
      • Data Preparation and Provisioning
      • Development
      • DevOps
      • Performance Monitoring
      • Replication
      • Supported Platforms
        • IBM DB2
        • MySQL
        • Oracle
        • PostgreSQL
        • SAP Solutions
        • SQL Server
    • GDPR Compliance
    • Identity & Access Management
      • Overview
      • Identity Administration
      • Identity Governance
      • Privileged Access Management
      • AD Account Lifecycle Management
      • Access Control
      • Cloud
      • Log Management
    • Microsoft Platform Management
      • Overview
      • Mergers & Acquisitions
      • Migration & Consolidation
      • Office 365 Migration & Management
      • Security & Compliance
      • Windows Backup & Recovery
      • Supported Platforms
        • Active Directory
        • Cisco
        • Exchange
        • Google
        • Groupwise
        • Lotus Notes
        • Office 365
        • OneDrive for Business
        • SharePoint
        • SQL Server
        • Teams
        • Unix/Linux
        • Windows Server
    • Performance Monitoring
      • Overview
      • Database Performance Monitoring
      • Operating System Monitoring
      • Storage Performance & Utilization Management
      • Supported Platforms
        • Active Directory
        • DB2
        • Exchange
        • Java
        • Hyper-V
        • .NET
        • Oracle
        • SAP/Sybase
        • Storage
        • SQL Server
        • VMware
    • Unified Endpoint Management
      • Overview
      • Endpoint Compliance
      • Endpoint Security
      • Endpoint Visibility
      • Industries
        • Education
        • Healthcare
      • Supported Platforms
        • Internet of things
        • Microsoft® Windows
        • MAC
        • UNIX/LinuX
  • Resources
    • Blogs
      • Data Protection
      • Database Management
      • IT industry Insights
      • IT Ninja
      • Microsoft Platform Management
      • Performance Monitoring
      • Toad World Blog
      • Unified Endpoint Management
    • Customer Stories
    • Documents
    • Events
    • Webcasts
    • Technical Documentation
    • Videos
    • Whitepapers
  • Trials
  • Services
    • Consulting Services
      • Overview
      • Microsoft Platform Services
      • Data Protection Services
      • Unified Endpoint Management
      • Performance Monitoring Services
      • Database Management Services
    • Educational Services
    • Support Services
  • Support
    • Support Home
    • By Product
      • All Products
      • AppAssure
      • Archive Manager
      • Change Auditor
      • Desktop Authority
      • DR Series
      • Foglight
      • KACE
      • Migration Manager
      • NetVault
      • Rapid Recovery
      • SharePlex
      • Toad
      • vRanger
    • Contact Support
      • Overview
      • Customer Service
      • Licensing Assistance
      • Renewal Assistance
      • Technical Support
    • Download Software
    • Knowledge Base
    • My Account
      • My Products
      • My Service Requests
      • My Licenses
      • My Groups
      • My Profile
    • Policies & Procedures
    • Consulting Services
      • Microsoft Platform Management
      • Data Protection
      • Unified Endpoint Management
      • Performance Monitoring
      • Database Management
    • Technical Documentation
    • Educational Services
    • User Forums
    • Video Tutorials
  • Partners
    • Overview
    • Partner Circle Log In
    • Become a Partner
    • Find a Partner
    • Partner Community
  • Blogs
    • IT Industry Insights
    • Quest Solution Blogs
      • Data Protection
      • Database Management
      • ITNinja
      • Microsoft Platform Management
      • Performance Monitoring
      • Toad World Blog
      • Unified Endpoint Management
  • Forums
  • 製品情報
    • すべての製品情報を見る
    • Change Auditor
    • Foglight
    • KACE
    • Metalogix
    • Migration Manager
    • Migrator for Notes to SharePoint
    • NetVault Backup
    • On Demand Migration for Email
    • QoreStor
    • Rapid Recovery
    • Recovery Manager
    • SharePlex
    • Spotlight
    • Toad
  • ソリューション
    • すべてのプラットフォームを見る
    • クラウド管理
    • GDPRコンプライアンス
    • データ保護
      • 概要
      • クラウド管理
      • ディザスタリカバリ
      • バックアップとリカバリ
      • Office 365 データ保護
      • 仮想化管理
      • 重複除外と複製
    • データベース管理
      • 概要
      • DevOps
      • データの準備と分析
      • データベースのクラウド移行
      • データベースパフォーマンス監視
      • データベース管理
      • データベース複製ソフトウェアツール
    • 統合エンドポイント管理
      • 概要
      • エンドポイントコンプライアンス
      • エンドポイントセキュリティ
      • エンドポイントの可視化
    • Microsoftプラットフォーム管理
      • 概要
      • ハイブリッドActive Directoryのセキュリティとガバナンス
      • Microsoftプラットフォームの移行計画と統合
      • セキュリティとコンプライアンス
      • 情報アーカイブおよびストレージ管理ソリューション
      • Windowsのバックアップとリカバリ
      • Microsoft Serverのパフォーマンスと可用性
      • レポート作成機能
      • グループポリシーと権限
    • パフォーマンス監視
  • サービス
    • コンサルティングサービス
      • 概要
      • Microsoftプラットフォーム管理
      • データ保護
      • 統合エンドポイント管理
      • パフォーマンス監視
      • データベース管理
    • トレーニングと認定資格
    • サポートサービス
  • サポート
    • サポートホーム
    • 製品で検索
      • All Products
      • AppAssure
      • Archive Manager
      • Change Auditor
      • Desktop Authority
      • DR Series
      • Foglight
      • KACE
      • Migration Manager
      • NetVault
      • Rapid Recovery
      • SharePlex
      • Toad
      • vRanger
    • お問い合わせ
      • すべて
      • カスタマサービス
      • ライセンス アシスタンス
      • 更新のアシスタンス
      • 技術サポート
    • コミュニティフォーラム
    • ソフトウェアのダウンロード
    • ナレッジベ%E3%83%BCス
    • マイアカウント
      • マイ プロダクト
      • Myサービスリクエスト
      • マイ ライセンス
      • マイ グループ
      • マイ プロファイル
    • ポリシーおよび手順
    • コンサルティングサービス
      • Microsoftプラットフォーム管理
      • データ保護
      • 統合エンドポイント管理
      • パフォーマンス監視
      • データベース管理
    • リリースノートおよびガイド
    • 教育サービス
    • ビデオチュートリアル
  • トライアル
  • パートナー
    • 概要
    • Partner Circleへのログイン
    • パートナーになる
    • Find a Partner
    • パートナーコミュニティ
  • コミュニティ
Quest Community
Quest Community
  • Site
  • User
  • Site
  • Search
  • User
Foglight
Foglight
Foglight Administrators Custom Script Agent 2: Build a WCF Dashboard to View the Custom Agent Data
  • Forum
  • Wikis
  • Sub-Groups
  • More
  • Cancel
  • New
  • -Foglight Administrators
    • A New Foglight Service Status Widget - Text with Colored Background
    • Adding APM views to an existing Foglight Java cartridge installation
    • Adventures in Agent Creation - Part 1
    • Adventures in Agent Creation - Part 2
    • Adventures in Agent Creation - Part 3
    • Anonymizing the Foglight End User Monitoring Solution
    • Another Foglight Service Status Widget - Colored Text
    • Building a custom dashboard to summarize LogFilter alarms
    • Building a geo drag and drop Foglight dashboard for a service
    • Building Complex Schedules with Foglight
    • Busting Frame Busters in Foglight Experience Viewer (FxV)
    • Community Cartridge: Notification Management Cartridge
    • Compatibility for Navigation Timing API
    • Configuring Internet Explorer 9 (IE9), to best work with Foglight
    • Converting Foglight 4 Script Agents to Foglight 5
    • Creating Load Testing Scripts from FxM and FxV Session Data
    • Custom Agents - Introduction to Script Agents
    • Custom Agents - Script Agent Data Modeling and Units
    • Custom Foglight Dashboards: adding alarm colors to spinners, jelly beans and other gauges
    • Custom Script Agent 1: Leverage an Existing Monitoring Script To Push Data into Foglight
    • Custom Script Agent 2: Build a WCF Dashboard to View the Custom Agent Data
    • Custom Script Agent 3: Add a Metric and Build a WCF Chart to Display it
    • Custom Script Agent 4: Add a Metric to a Table
    • Customizing Foglight – Expert Services Discount Available for a Limited Time!
    • Customizing the out-of-the-box Host Status view
    • Dashboard speed-up
    • Deploying Two FglAMs to the Same Windows Host and running each as a Windows Service
    • Different Thresholds for Different Tablespaces
    • Different Thresholds for Different Tablespaces - Part 2
    • Emailing reports with the proper name and format
    • FGL IDE (Export Customizations & more)
    • Flexible, Cost-effective Remote Administration Services
    • Foglight 5 - Topology Localization
    • Foglight Advanced Administration Training - Limited Space for February 2012
    • Foglight APM Basics (Videos)
    • Foglight APM Features (videos)
    • +Foglight Best Practices
    • Foglight Best Practices (videos)
    • Foglight Best Practices Monthly Webcast – Sign Up for Session 1!
    • Foglight Best Practices: Dashboards and Reports Webcast Registration Open Now!
    • Foglight dashboard as a SharePoint WebPart
    • Foglight Dev Camp & Hackathon 2017
    • Foglight End User Management: Using Network TAPs versus a Switch SPAN Port
    • Foglight End User Service Availability Reporting, Foglight Experience Monitor or Foglight Transaction Recorder which one to use?
    • Foglight Event Synchronization Solution for HP Operations Manager Services Pack Available Now!
    • Foglight Experience Viewer (FxV) URL Search Shortcuts
    • Foglight Host OS Monitoring (videos)
    • Foglight iGoogle Gadget
    • Foglight nologinuser dashboard in SharePoint
    • Foglight Public Virtual Training Courses
    • Foglight Quickstart Services Offering
    • Foglight Reporting using Metric Queries or Groovy
    • Foglight Training Classes -- Public and Private Options Available
    • Foglight Training Packages with Free Healthcheck Services - Limited Time Offer
    • Fraud Support with FxV
    • FxM and Apache Proxy Server (X-Forwarded-Host)
    • FxM: IP Multicasting and Sessionizing
    • FxV Storage Tier Expansion & Analysis Repository Considerations
    • Getting the most out of Foglight's .NET Monitoring - Part 1
    • Getting the most out of Foglight's .NET Monitoring - Part 2: Agent Configuration Specifics and Best Practices
    • Getting the most out of Foglight's .NET Monitoring - Part 3: Monitoring a .NET Executable Application
    • HDIDT - View an Exported Real User Session File
    • How are your Java components processing?
    • How to Handle NTLM within UEM
    • Improve Organizational Adoption of Your APM Solution
    • January Foglight Best Practices Thursday, January 5 - Register Now!
    • Java APM
    • June 2012 Best Practices Webcast Open for Registration!
    • Migrating your Foglight Management Server
    • Monitoring .NET Request Memory Usage with Foglight
    • Monitoring an independent Java process using Foglight
    • Monitoring application availability using Foglight Utility Agents
    • New Foglight Services Packs Available
    • New Sizing Guide for FxM and FxV
    • New UEM Sizing Guide
    • Predicting the Impact of Moving a Guest to Another Host
    • +Quest Application Performance Monitoring (APM) Implementation Methodology
    • Reading a XML File with a powershell script agent
    • Really Simple (Foglight) Syndication
    • Services Section of Quest.com Gets a Facelift
    • Setting the value of a Registry Variable from the Command Line
    • SNMP trap variables in Foglight Alarms
    • The End-User as an Instrument...
    • Thoughts from the road - Foglight Java agent Tag and Follow
    • Thoughts from the road – User session replay - YOU CAN ACTUALLY DO THAT???
    • Training Update - New Foglight Reporting Course Available
    • Understanding Foglight Metrics
    • Updates to Quest's Foglight Public Virtual Training Calendar
    • Use a Foglight to monitor itself
    • Use Foglight to Drive Business Performance
    • Use Foglight to monitor itself
    • User Experience Mgmt Overview
    • Using telnet or wget to check connectivity
    • Using the ConfigService API to setup agent properties (ASPs)
    • Utilizing MS Exchange distribution lists to help with user attribute maintenance
    • We've Redesigned SupportLink to Get You Answers Faster Than Ever - See for Yourself and Enter to Win an iPad!
    • [Case Scenario] - How to avoid duplicate rows when building a report with 5 min granular data
  • (iNdOrE) && (GwAlIoR) +91-9915786526 ##LoVe Marriage Specialist Pandit ji kota
  • Custom Script Agent - Counting Files in a Windows Folder - How-To
  • Foglight Admin 101
  • Foglight monitoring application components running on Docker Containers
  • Foglight User 101
  • Memory Utilization for all processes over X months
  • NetMonitor - Quick How-To Guide
  • Setting JBoss Server name and domain in Foglight
  • Setting Tomcat server name and domain in Foglight
  • testing a bug - Do not publish
  • WebMonitor - Quick How-To Guide
  • WebMonitor agent installation

Custom Script Agent 2: Build a WCF Dashboard to View the Custom Agent Data

In the previous installment of this series, Quest Principal Solutions Architect Brian Wheeldon created a custom script agent to push data into Foglight and trigger an alert. In this continuation, he steps through the process of building a WCF dashboard to view the agent data highlighting best practices along the way.

Requirements

After deploying and activating a script agent and configuring a rule to trigger an alert if the agent indicates a problem, we have basic monitoring in place. But in addition to getting alerts when something breaks we'd also like to be able to easily validate that the monitored TCP ports are healthy. The data is visible in the Foglight model, but it's not in a convenient place to inspect, or presented in a useful way for Foglight operators.

We can get a pretty good result by configuring a drag and drop dashboard:

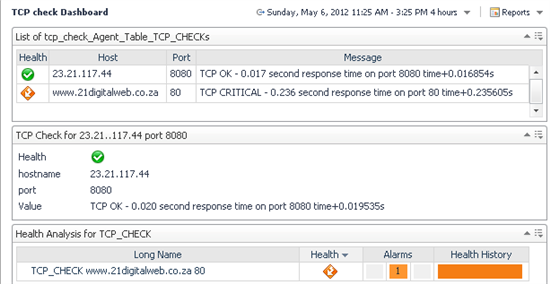
But this dashboard is static and we'd ideally like to see a dashboard that automatically populates when new TCP Check agents are deployed and activated. We'd also like to have fine-grained control of flow actions like pop ups and drilldowns.

For these two reasons (and because WCF is cool) we'll step through the process of creating a WCF dashboard for this custom agent. We'll use the drag and drop table at the top of the screenshot above as the starting design reference for our dashboard.

Getting Started with WCF

WCF (Web Console Framework) is the technology underlying all Foglight dashboards and reports. WCF consists of a rich set of configurable components that can be combined in uncountable ways to produce great-looking dashboards and reports. Drag and Drop dashboards and reports are built with a limited set of these compoents that can be configured in a limited sets of ways. WCF components are configured through the Configuration/Definiton dashboard in a set of screens that ultimately act as XML editors that open up a rich and powerful set of visualization options. This is the same configuration editor that Foglight cartridge develoers use to produce the out-of-the-box dashboards and reports that have become so popular with Foglight customers across many industries.

This article doesn't assume any familiarity with WCF, but you can learn more from the WCF tutorials in Foglight Help, or other articles in the Foglight Community.

The screenshots shown below are from Foglight 5.6. The WCF definition editor screens look a bit different in Foglight 5.5, but if you set each property to the same value, you should get the same result.

Setup

In order to create sharable "System" dashboards, you must log onto Foglight as a user with the "Dashboard Designer" role. Since Foglight 5.6, the default "foglight" user doesn't have this role. A user with "Foglight Security Administrator" can grant the "Dashboard Designer" role to a group or individual.

Best Practice: Prototype WCF dashboards on a staging or test FMS. Avoid cluttering Production FMSs with experimental views.

Once logged in as a "Dashboard Designer", create a module that will contain the custom views. Since WCF dashboards are query-driven rather than data-driven, WCF modules can be exported from one FMS and imported to another.

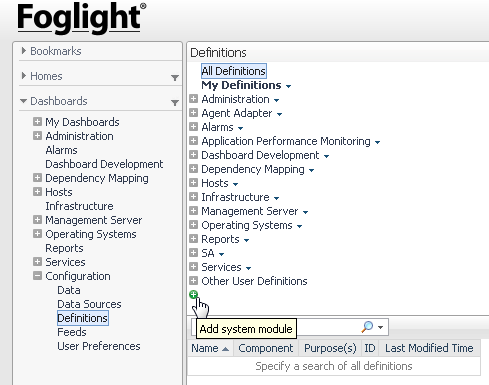
To create a new WCF System module, open the left navigation panel and select "Definitions" from the "Configuration" group under "Dashboards". In the top left pane of the Splitter window that appears, you will find a green "+" button at the bottom of the list. Click on this button to create a new system module.

You will be prompted for a name for the module and you can optionally enter a description, logo, and Allowed Role(s) for the module. Make sure that you enter at least one Relevant Role for the module. I recommend starting with Operator and Advanced Operator roles.

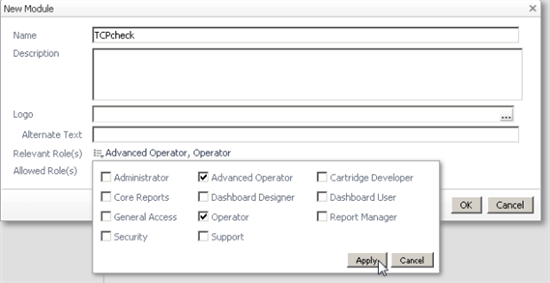
Set the name of the module to TCPcheck and select Advanced Operator, Operator as the "Relevant Role(s)", Click OK.

Best Practice: Choose a short but meaningful name for your custom dashboard module. It's easier to export and import the dashboard if there are no spaces in the name. You can set the display name for the module separately.

Building Queries

Once you've created a module to contain the custom views, you're ready to start building. You can add many types of elements to the module including Functions, Renderers, Types, Tasks, Icons, Files and Mappings, but stick to the basics: Queries and Views for now.

One of the most powerful things about WCF dashboards is that they are query driven. This means that these dashboards will automatically adjust when the target data model changes. To address the requirement for "a dashboard that automatically populates when new TCP Check agents are deployed and activated", we'll define a query that finds all the "tcp_check" agents in the model. We'll follow that up with a query to find all the "tcp_check" data tables given a set of "tcp_check" agents. Queries are basically just easy way to navigate Foglight models and return a list objects that match a specification given a starting place and a path to traverse.

Although the WCF editors look pretty complicated at first glance, you'll find with a bit of practice that they get easier to understand and work with. You don't need to understand every option to build good dashboards. You can get good results by using just a few basic properties that we'll step through in this and subsequent tutorials.

Query to Return a List of Custom Agents

Select the module you just created in the top left pane and you will see a blank slate of dashboard elements in the bottom pane.

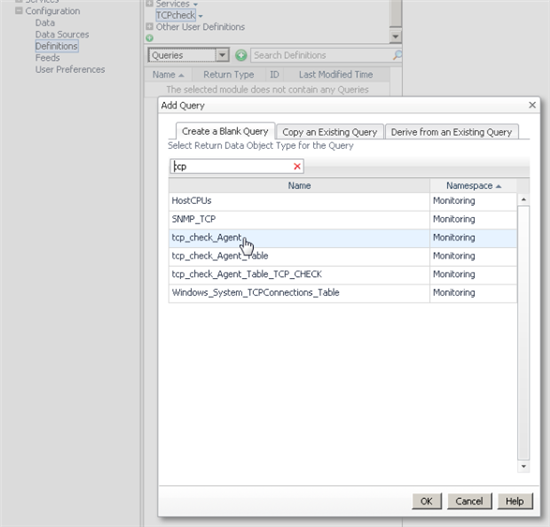
Change the combo box that says "View" to "Queries". Click the 'plus' button beside the combo box. In the Add Query dialog with the "Create a Blank Query" tab selected, enter "tcp" in the search box. Select "tcp_check_Agent" (or whatever your custom agent name is) from the list and click OK.

The Query editor will appear in the main panel of the page.

Set the name of the query to "allTCPcheckAgents"

Set Root Reference From to "Monitoring : (Default Instance)"

Set Path to "Agent Map"

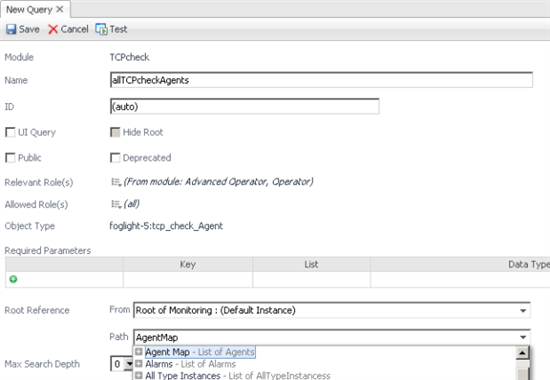
Click "Test" at the top. You should see your custom agent appear in the list. Click "Close"

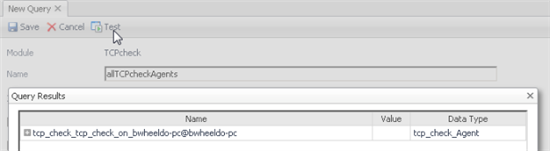
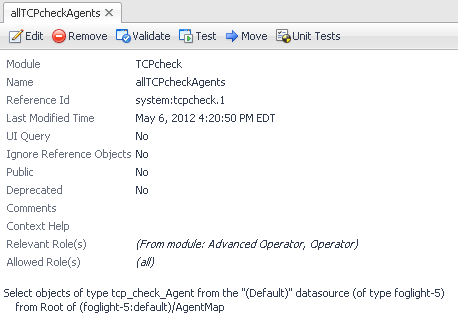
Click "Save" at the top. If you're new to WCF, you've just created your first query.

Query to Return a List of Agent Tables Given a List of Agents

The next query is similar, but this time there's an input parameter.

Click the 'plus' button beside the "Query" combo box again. In the Add Query dialog with the "Create a Blank Query" tab selected, you should see the results of the previous search for "tcp" in the search box. If not, search for your custom agent name again. Select "tcp_check_Agent_Table_TCP_CHECK" (or whatever your custom agent table name is) from the list and click OK.

The Query editor will appear in the main panel of the page.

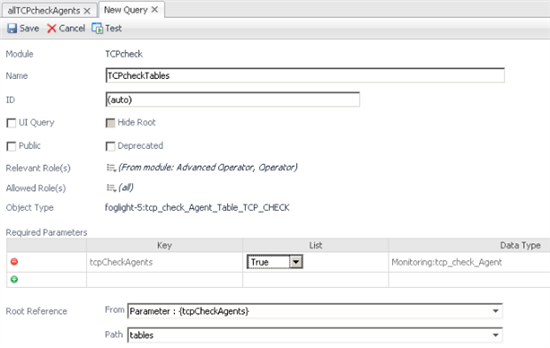
Set the name of the query to "TCPcheckTables"

Add the query parameter definition by clicking on the 'plus' button below "Required Parameters"

Below "Key", click and enter "tcpCheckAgents". Change the List value to "true". Click below "Data Type" and click the "..." button to pop up the editor.

In the Select Type editor, enter "tcp" in the search box and select "tcp_check_Agent" (or your agent name) from the list and click "Save".

This time, the query will start with the input agents and look for matching tables below them in the model.

Click in Root Reference From field. Open parameters, and select the key name you just configured for the parameter.

Click in the Path field, scroll down and select "Tables (list of F4Tables)".

The query configuration is complete.

Click "Test" at the top. You'll be prompted for the Input Value for "tcpCheckAgents".

Click on the "..." button and select Query.

In the Edit - tcpCheckAgents dialog, click the down arrow beside the Query field, scroll down and open the TCPcheck module, then select "allTCPcheckAgents", the query you just created. Click Set.

Click "Results" to test the new query.

You should see your custom agent table(s) appear in the list. Click "Close"

Best Practice: Use the Test button to make sure that you have configured your queries (and views) correctly.

Click "Save" at the top. You now have the basic queries required to build lots of useful dashboards and reports with your agent data.

Build a Row-Oriented Table to Display the Agent Data Table Values

Keeping your custom module ("TCPcheck") selected, change the "Queries" dropdown to "Views".

Click on the 'plus' button beside "Views". From the Add View dialog in the "Create a Blank View" tab, open "Common" and select "Row-Oriented Table". Click OK.

The Row-Oriented Table View editor appears in the main window. The editor has four tabs: General, Context, Configuration, and Flow.

General tab

These are the general properties of the view, which describe how the view will be used.

Set Name to "TCP Check Table"

Enable the "Public" checkbox.

Click on the Purpose(s) editor. Select Dashboard, Pagelet, Portlet. Click Apply.
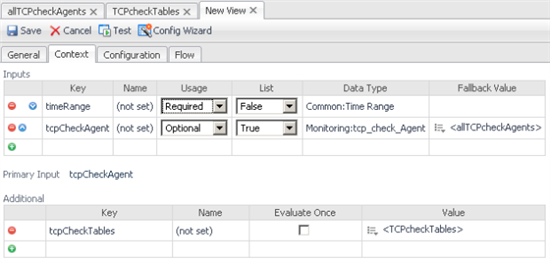
Context Tab

Context defines the inputs necessary to populate the view. "timeRange" is specified by default as almost all Foglight views respond to changes in the page time range. Inputs can be Required or Optional. If an input is Required, then the view can't draw unless that input is supplied. If an input is optional, provide a default value but allow the default to be overridden by a parent view. For this dynamic custom agent table, start by configuring a list of custom agents as an optional input and set the agent query defined above as the default value. Next, use the second query in "Additional" inputs to get the list of data tables from the agents defined in the Inputs section. These are the detailed steps:

Define Required Inputs

In the Input table, click on the 'plus' button in the second row, below timeRange.

In the Key column, replace "(not named)" with "tcpCheckAgents".

Change Usage to Optional

Change List to True

Click in the field in the Data Type column and click the "..." button.

In the Select Type dialog, enter "tcp" in the search field and select "tcp_check_Agent" from the result list. Click Save.

Click the 'edit' button in the Fallback Value column and select Query.

In the Edit - Context Input Entry "tcpCheckAgent", click the Query 'down' arrow, scroll down, open "TCPCheck" and select the "allTCPcheckAgents" query created above. Click Set.

Set Primary Input to "tcpCheckAgents".

Define Additional Inputs

In the Additional table, click on the 'plus' button in the first row.

In the Key column, replace "(not named)" with "tcpCheckTables".

Click the 'edit' button in the Value column and select Set to Binding > Query.

In the Edit - Context Input Entry "tcpCheckTables", click the Query 'down' arrow, scroll down, open "TCPCheck" and select the "TCPcheckTables" query. You will be prompted for the value of Parameter tcpCheckAgents. Click the 'edit' icon in the Value column and select Context. In the popup parameter editor, click on the down arrow in the Input Key field and select "tcpCheckAgent (List of tcp_check_Agents)". Click Set (parameter editor).

Click Set (context entry "tcpCheckTables").

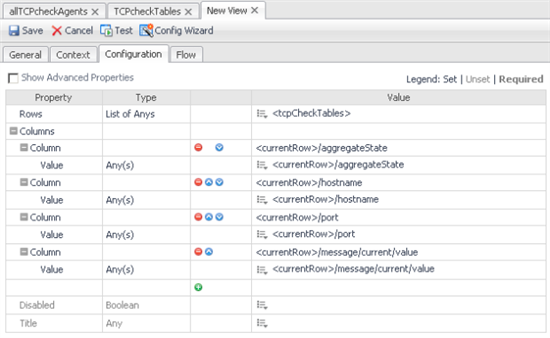
Configuration - Rows and Columns

The basic table properties and the input data for the table have been defined. Next set the items to be displayed in the table rows and columns. Each row represents a monitored TCP port. Configure the same columns as the drag/drop table shown at the top of the first screenshot above.

Select the Configuration Tab

Rows: Click the 'edit' icon in the Value column beside Rows and select Context. Drop down the Input Key selector and select "tcpCheckTables (List of tcp_check_Agent_Table_TCP_CHECKs)". Click Set

.

Open Columns.

Column 1: Open Column.

Click the 'edit' button in the Value column beside the Value field and select Context.

In the Edit - Value dialog, drop down the Input Key field and select "currentRow (tcp_check_Agent_Table_TCP_CHECK)".

In the Path drop down, check "show all" and select "Aggregate State - Integer". This will appear as "aggregateState" in the Path field. Click Set.

Column 2: Click on the 'plus' sign to add a new column.

For the second column, click the 'edit' icon beside Value and select Context.

In the Edit - Value dialog, drop down the Input Key field and select "currentRow (tcp_check_Agent_Table_TCP_CHECK)".

In the Path drop down, select "hostname - String". This will appear as "hostname" in the Path field. Click Set.

Column 3: Click on the 'plus' sign to add a new column.

For the third column, click the 'edit' icon beside Value and select Context.

In the Edit - Value dialog, drop down the Input Key field and select "currentRow (tcp_check_Agent_Table_TCP_CHECK)".

In the Path drop down, select "port - String". This will appear as "port" in the Path field.Click Set.

Column 4: Click on the 'plus' sign to add a new column.

For the fourth column, click the 'edit' icon beside Value and select Context.

In the Edit - Value dialog, drop down the Input Key field and select "currentRow (tcp_check_Agent_Table_TCP_CHECK)".

In the Path drop down, open "message - String Observation". Open "Current - StringValue". Select "value - String". This will appear as "message/current/value" in the Path field. Click Set.

That's enough configuration for now. We'll refine the table once it's been tested.

Click Save at the top to save this Row-Oriented Table view.

Click on the Test button. Accept the default Input Values and click Results.

Depending on your browser, you may need to enable popups from this FMS in order to see the test table.

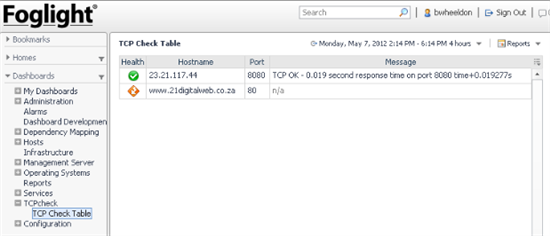
It should look something like this:
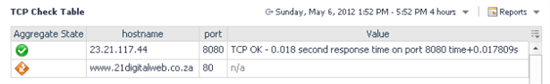
Refine the Table

This is pretty good, but some refinements are required:

  • Change column titles to: "Health", "Hostname", "Port", and "Message".
  • Center the icon in the "Health" column.

Return to the WCF Definitions editor.

Edit TCP Check Table

Open the Configuration Tab

Enable "Show Advanced Properties"

Open Columns

Open the first Column

Set ID=health

Click the edit icon beside "Header". Select "Set to Binding>Localized String".

In the Localized string editor, enter "Health". Click Set.

Open Cell Alignment. Click the edit icon beside Horizontal. Select Center.

Current Sort Order=Descending

Close the first column

Open the second Column

Set ID=hostname

Click the edit icon beside "Header". Select "Set to Binding>Localized String".

In the Localized string editor, enter "Hostname". Click Set.

Close the second column

Open the third Column

Set ID=port

Click the edit icon beside "Header". Select "Set to Binding>Localized String".

In the Localized string editor, enter "Port". Click Set.

Close the third column

Open the fourth Column

Set ID=message

Click the edit icon beside "Header". Select "Set to Binding>Localized String".

In the Localized string editor, enter "Message". Click Set.

Close the fourth column

Best Practice: Set the ID of each column to a brief meaningful name. This makes it easier to identify which column is which in the editor, and also enables customized actions for each column on click or dwell.

Save the view "TCP Check Table"

The definition summary for this view should look something like this:

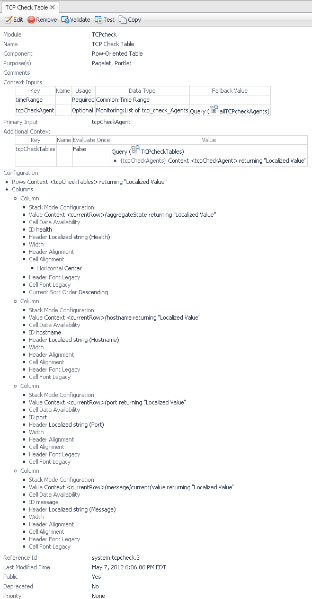
Congratulations, you've built a WCF dashboard and drag/drop Portlet!

You can view this dashboard by selecting TCP Check Table under TCPcheck in the left Navigation page.

You can also drag and drop this table on a custom portal by selecting it from the right Action panel Views tab: TCPcheck/TCP Check Table.

In the next installment of this series, we'll configure the TCP response time as a Metric and add it to this dashboard.

Please post a comment if you successfully complete these steps or get stuck along the way.

If you have other questions about WCF, you can post these questions in the Custom Dashboards & Scripts Discussion Forum.

Happy Dashboarding!

Brian Wheeldon

  • Foglight Administration custom dashboard
  • portlet
  • row-oriented table
  • wcf
  • query
  • dashboarding
  • Share
  • History
  • More
  • Cancel
Related
Recommended
  • Company
    • About Us
    • Buy
    • Contact Us
    • Careers
    • News
  • Resources
    • Industry Insights Blog
    • Communities
    • Customer Stories
    • Documents
    • Events
  • Support
    • Professional Services
    • Renew Support
    • Technical Support
    • Training & Certification
    • Support Services
  • Social Networks
    • Facebook
    • LinkedIn
    • Twitter
    • YouTube
  • © 2023 Quest Software Inc. ALL RIGHTS RESERVED.
  • Legal
  • Terms of Use
  • Privacy
  • Community Feedback & Support
  • Cookie Preference Center
  • 会社名
    • 会社情報
    • 購入
    • お問い合わせ
    • 採用情報
    • ニュース
  • リソース
    • ブログ
    • お客様の事例
    • ドキュメント
    • イベント
    • ビデオ
  • サポート
    • プロフェッショナルサービス
    • サポートの更新
    • テクニカルサポート
    • トレーニングと認定資格
    • サポートサービス
  • ソーシャルネットワーク
    • Facebook
    • Instagram
    • LinkedIn
    • Twitter
    • YouTube
  • © 2023 Quest Software Inc. ALL RIGHTS RESERVED.
  • 「法務」
  • ご利用規約
  • 個人情報保護方針
  • コミュニティのフィードバックとサポート