Golan Shem-Tov here with the Foglight Solutions Architects team at Quest.
In many cases when you ask customers that have some legacy or non standard applications how they check if the application is ok you get answers like “I check if the process is running” “ I check if the web page is available” “I check if there are any errors in the log files”.
Wouldn’t it be nice if Foglight could do that for you especially if there are many systems or applications involved?
Well, Foglight can!
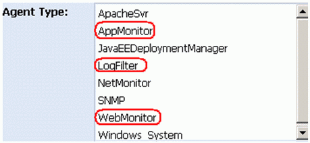
After installing OS cartridge on Foglight, when creating an agent you can see the following list:
Almost everybody knows the System agents that monitor the OS and heard of the Java agent but what are, AppMonitor, LogFilter, and WebMointor agents?
AppMonitor - a utility agent that monitors the availability and resource usage (memory/CPU) of process or a group of processes.
WebMonitor – a utility agent that monitors Web page availability and response time.
LogFilter – a utility agent that monitors the log files on your system and searches for literal strings and other regular expressions that are defined in the agent properties as warning/critical/fatal event.
Use them (together or separately) and you have the ability automate the process of monitoring processes, web pages and log files in a large environment.
AppMonitor
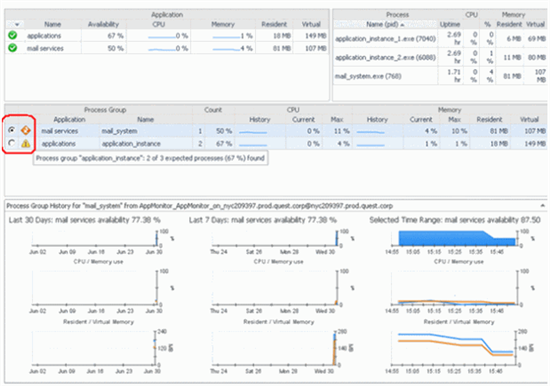
Let’s take for example a system that requires two mail servers and three application instances to run properly. All we have to do is deploy an appmonitor agent, edit its properties to specify the Application/process list that is expected.
Starting this agent we can see the monitoring information under Operating Systems > Appmonitor Analysis > Application monitor. As you can see, in this case the dashboard is also indicating that both the mail services and the applications do not have the number of instances expected and well as show the memory and CPU consumption.
WebMonitor
To monitor your application web server or a web page availability all you have to do is deploy a web monitor agent and specify in the Servers/URLs file list file the web pages you want to monitor, in this case we chose a specific page on foglight.org . You can also specify if you want to monitor the download of the entire page or just the header.
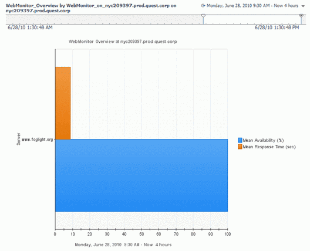
The result can be found under Operating systems > WebMonitor
You can see the web page availability and response time
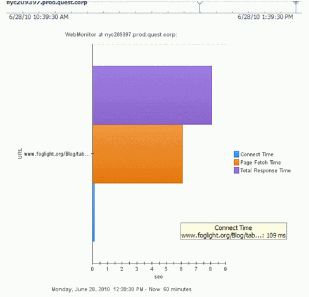
As well as the breakdown between connect time, fetch time in the total response time.
And if for some reason server or the page is not available we get an error
LogFilter
The idea with log filter is quite simple, when you look at a log file you are looking for key words that indicate a problem. It would be nicer if somebody just warned you when words that indicate a problem start to appear in your log files and that’s what log filter does.
You create a log filter agent and give it a list of file names, location and indication if rolling files is enabled.
Then you give it a list of keywords that indicate a problem and what level of severity the key words are associated with.
Now all you have to do is to wait for Foglight to notify you about problems in your log files.
For full usage of the utility agents (using regular expressions in log filter and other advanced options) please check the cartridge for operating system guide and reference. In future articles I will cover other utility agents.
I hope you find this article useful, don’t hesitate to contact me with questions and remarks to gshemtov@quest.com
Golan Shem-Tov
Quest Software


