
Metric Queries
Foglight has a built in metric query language for extracting data from Foglight models.
Metric queries can be run in the Script Editor in Administration/Tooling.
Metric queries can also be run from the command line using 'fglcmd'.
Here is some examples of metric queries:
#utilization from Memory where host.name = 'torpsv011.sitraka.com' for 5 hours#
#utilization from HostCPUs where host.name like '%.sitraka.com' for 5 hours 2 days ago#
The first example extracts all observations of 'utilization' from a table called 'Memory' from a specific host over the last five hours. The second example extracts average CPU utilization across all CPUs for a set of hosts that match the given filter ('%' is a wildcard). All matching observations over a five hour period from two days ago are selected.
The result of queries like this can be aggregated using functions like avg(), max(), sum() when run from the Script Editor in Adminstration/Tooling:
avg(#utilization from Memory where host.name = 'torpsv010.sitraka.com' spanning 1.5 hours ending at 14:30 on 2010-07-15#)
max(#utilization from HostCPUs where host.name = 'torpsv010.sitraka.com' spanning 1.5 hours starting at 14:30 1 day ago#)
This type of calculation is commonly used in Derived Metrics and Rules, as well as for reporting.
Metric Queries can be used to export data in either CSV or XML format from the Foglight Management Server (FMS) using the command line 'fglcmd'.
You can run 'fglcmd' from any host, not only the FMS and monitored hosts.
In $FMSHOME/tools/, you'll find fglcmd.zip. You can extract this file on any host, and run it from there.
You'll need to have the JAVA_HOME environment variable set when you run it, because the package does not includes a JRE.
Windows (CSV):
C:\Quest_Software\Foglight555\bin>fglcmd.bat -srv 10.4.118.101 -port 8080
-usr fgluser -pwd fgl1pwd
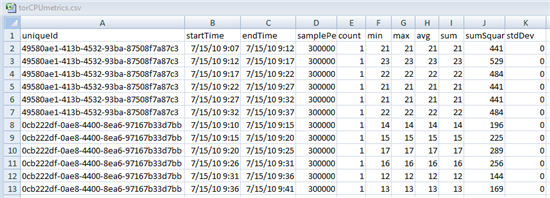
-cmd util:metricexport -output_format csv -f torCPUmetrics.csv
-metric_query
"CPU_Utilization from Windows_System_System_Table where agent.host.name like 'tor%' for 30 minutes"
generates:
Unix (XML):
$ /opt/foglight55/bin/fglcmd.sh -srv 10.4.118.110 -usr foglight -pwd foglight
      -cmd util:metricexport -output_format xml -f torCPUmetrics.xml
      -metric_query "utilization from HostCPUs where host.name like 'torpsv%' for 30 minutes"
generates:
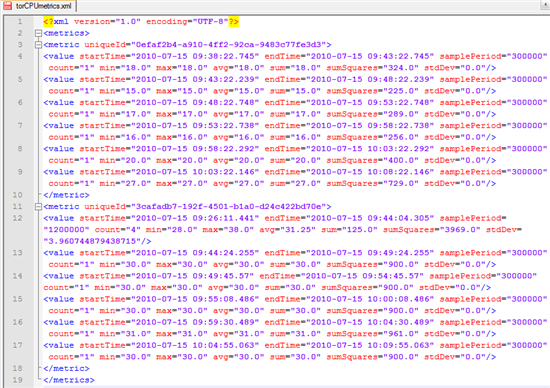
In both examples, the query matches metrics from two different hosts and writes the selected metric from both hosts to the output CSV or XML file.
uniqueID is an FMS-specific reference to the object.
For example, using the uniqueId generated in the XML file, run this Groovy in the Script Editor:
uniqueId = '0efaf2b4-a910-4ff2-92ca-9483c77fe3d3'
def topSvc = server[TopologyService] topSvc.getObject(uniqueId).getContainer().getName() +   +
topSvc.getObject(uniqueId).getName()
The result is (for example):
torpsv010.sitraka.com CPUs
The startTime and endTime refer to the time range for the observation.
The samplePeriod, in milliseconds, is the difference between the startTime and endTime.
'count' refers to the number of observations in the time range. Recently collected observations will show a count of '1'. As data ages in the FMS, data persistence policies will trigger aggregation of a number of observations and count will increase.
min, max, avg, and sum represent the range of values in the time period. For recently collected metrics, these values will all be the same. As the data ages, the observations will be aggregated, but these key indicators will persist.
sumSquares is used internally by the FMS for calculating the aggregations.
stdDev indicates the 'volatility' of the data.
For more information about Metric Queries and Topology Queries in Foglight, search for "Query language tutorial" or "Query language examples" in Foglight's Help. For more information about 'fglcmd', review the "Command-Line Reference Guide" in the Foglight Administration Guide or Foglight's Help.
This export capability is useful, but it has some limitations.
- You can only export one metric from one or more topology objects. So you can export the CPU Utilization for one host or for all Windows hosts but not CPU, Memory and and FileSystem metrics in one query.
- The exported CSV or XML file contains a uniqueId that's meaningful to the FMS that exported it, but the value is not human readable and requires additional processing to make it easy to understand.
- The exported CSV or XML file contains all the metric fields. There
is no way to remove or re-order these columns.
For more flexible reporting that overcomes these limitations, we need to use Groovy.
Groovy
Metric queries are powerful, concise and relatively simple, but they don't offer the kind of flexibility often required for reporting.
If we want to extract metrics from Foglight into well-designed, easy-to-read CSV reports, then we need to leverage the power and flexibility of Groovy.
Groovy is a Java-based scripting language that you can download from http://groovy.codehaus.org.
Groovy is based on Java and includes all Java operations and libraries, but also a number of 'shortcuts' that make it more concise and easy to read. Although it's helpful to know basic Java syntax, Groovy users don't need to know Java.
To learn more about Groovy, see: Getting Started Guide
Reference Card (PDF) (registration necessary)
Groovy In Action Book: http://www.manning.com/koenig/
Foglight uses Groovy for many functions, including:
- Rules
- Derived Metrics
- Actions
- Functions
- Persistence policies
Groovy can be run on the FMS via 'fglcmd' command line to generate reports. You can also use the Script Editor in Administration/Tooling to prototype and test the following reports.
I'd like to thank Stefan Marx for providing the foundation on which most of these reports are based.
Groovy Report Examples
The following examples represent a few of the more common types of reports that have been created for various clients.
With some practice and some trial and error in the Script Editor and the Data Browser, many of these resports can be adapted to other agent and metric types as well as other formats.
As noted, these scripts are unsupported. But if you have questions or comments, please post a comment on this page or post a new topic in the discussion forum.
Generate a list of all current alarms with details
Example output .csv in Excel:

Run the following script from the command line using:
fglcmd.sh -srv 10.4.118.110 -port 8080 -usr foguser -pwd fog1pwd -cmd script:run -f expAlarms.groovy >alarmExport.csv
expAlarms.groovy
// This script comes with no support, expressed or implied.
import com.quest.nitro.service.alarm.*;
import com.quest.nitro.service.sl.interfaces.alarm.*;
topSvc = server.get("TopologyService");
almSvc = server.get("AlarmService");
rulSvc = server.get("RuleService");
def getAlarmProperties(alarm)
     { def props = []
     id = null
     try {
               id = alarm.getID();
     }
     catch (Exception e){
     }
     props.add(id == null ? "" : id);
     ti = null
     try {
               ti = alarm.getTopologyObjectID()
     }
     catch (Exception e){
     }
     props.add(ti == null ? "" : ti);
     props.add(alarm.getCreatedTime());
     props.add(alarm.getIsCleared());
     props.add(alarm.getSourceName());
     props.add(alarm.getSeverity());
     props.add("\"" + alarm.getMessage() + "\"");
     to = null
     hostname = null;
     agentname = null;
     try {
               to = topSvc.getObject(ti);
               hostname =  (to == null) ? null : to.get("monitoredHost/name");
               agentname =  (to == null) ? null : to.get("monitoringAgent/name");
     }
     catch (Exception e){
     }
     props.add(hostname == null ? "" : hostname);
     props.add(agentname == null ? "" : agentname );
     ri = null;
     rule = null
     try {
               ri = alarm.getRuleID();
               rule = (ri == null) ? null : rulSvc.getRule(ri);
               props.add(rule == null ? "" : rule.getName());
     }
     catch (Exception e){
     }
     return props
}
////////////////////////
// get Data and Export
////////////////////////

alarms = almSvc.getCurrentAlarms();
//alarmCount=alarms.size();

def expAlarms = []

alarms.each{ _alarm ->
          expAlarms.add(getAlarmProperties(_alarm))
}

// Build Result
StringBuffer buffer = new StringBuffer();
buffer.append("AlarmID,TopologyID,Created,Cleared?,Source,Severity,Message,Host,Agent,Rule\n");
expAlarms.each{m->
          int i = 0;
          m.each {k->
          buffer.append((i>0?",":"")+k)
          i++
          }
          buffer.append("\n")
}
return buffer
Generate a list of "CPU max, min, avg" for all hosts in the specified time range by hour
Example output:
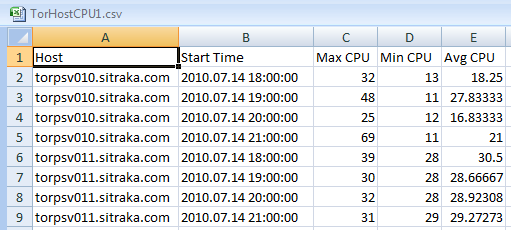
This report was created with a command line and script like:
D:\Quest_Software\Foglight55\bin\fglcmd.bat -srv 10.4.118.110 -port 8080 -usr foguser -pwd fog1pwd -cmd script:run -f exportHourlyMetrics.groovy "2010.07.14 18:00:00" "2010.07.14 22:00:00" > TorHostCPU1.csv
exportHourlyMetrics.groovy
// This script comes with no support, expressed or implied.
import java.sql.Timestamp.*;
import java.text.SimpleDateFormat

////////////////////
// Change the following lines according to your needs
/////////////////////

// Host model example
metric_parent = "HostCPUs where host.name like 'tor%'"
parent_label = "host/name"
metric_names = ["utilization"]
column_titles = "Host,Start Time,Max CPU,Min CPU,Avg CPU\n"

// Timing Setup
format = new SimpleDateFormat("yyyy.MM.dd HH:mm:ss");
//startTime = new Timestamp(System.currentTimeMillis()-(24*60*60*1000)) // 24 hours ago
//endTime = new Timestamp(System.currentTimeMillis())
//startTime = new Timestamp(format.parse("2010.03.30 18:00:00").getTime())
//endTime = new Timestamp(format.parse("2010.03.30 22:00:00").getTime())
startTime = new Timestamp(format.parse(args[1]).getTime());
endTime = new Timestamp(format.parse(args[2]).getTime());
step = 1000*60*60 // 1 hour

// Report generating code follows

def getMetricsFor(aInstance) {
          def metrics = []
          def windowStart = new Timestamp(startTime.getTime())
          def windowStop = new Timestamp(startTime.getTime()+step)
          while (windowStart < endTime) {
                    metrics.add(getMetricsFor(aInstance, windowStart, windowStop))
                    windowStart.setTime(windowStop.getTime())
                    windowStop.setTime(windowStop.getTime()+step)
          }
return metrics
}

def getMetricsFor(aInstance, windowStart, windowStop) {
          def ds = server["DataService"]
          def metric = []
          metric.add(aInstance.get(parent_label))
          metric.add(format.format(windowStart))
          metric_names.each{metric_name->
                    metric.add(ds.retrieveAggregate(aInstance, metric_name, windowStart, windowStop).getValue().getMax())
                    metric.add(ds.retrieveAggregate(aInstance, metric_name, windowStart, windowStop).getValue().getMin())
                    metric.add(ds.retrieveAggregate(aInstance, metric_name, windowStart, windowStop).getValue().getAvg())
          }
          return metric
}

////////////////////////
// get Data and Export
////////////////////////
def expMetrics = []
def instances = server.get("QueryService").queryTopologyObjects(metric_parent);
instances.each{ _instance ->
          expMetrics.addAll(getMetricsFor(_instance))
}

// Build Result
StringBuffer buffer = new StringBuffer();
// Change the following line to label the metric parent and metric columns
buffer.append(column_titles);
expMetrics.each{m->
          int i = 0;
          m.each{k->
          buffer.append((i>0?",":"")+k)
          i++
          }
          buffer.append("\n")
}
return buffer
For each host, generate the avg CPU and Memory for each day including only business hours
Example output:
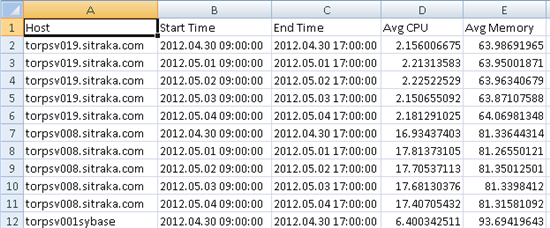
We add command line arguments to specify which days we want to export:
C:\Quest_Software\Foglight55\bin\fglcmd.bat -srv 10.4.118.110 -port 8080 -usr foguser -pwd fog1pwd -cmd script:run -f exportBusinessHours.groovy "2012.04.30" "2010.05.15" > TorHostBusinessHours1.csv
exportBusinessHours.groovy
// This script comes with no support, expressed or implied.
import java.sql.Timestamp
import java.text.SimpleDateFormat
//args = ["thisprogram", "2012.04.30", "2012.05.04"]
////////////////////
// Change the following lines according to your needs
/////////////////////
// Host model example
metric_parent = "Host where name like 'torpsv0%'"
parent_label = "name"
metric_names = ["cpus/utilization", "memory/utilization"]
column_titles = "Host,Start Time,End Time,Avg CPU,Avg Memory\n"
def output = new StringBuffer(column_titles)
// Timing Setup
format = new SimpleDateFormat("yyyy.MM.dd HH:mm:ss");
//startTime = new Timestamp(System.currentTimeMillis()-(24*60*60*1000)) // 24 hours ago
//endTime = new Timestamp(System.currentTimeMillis())
//startTime = new Timestamp(format.parse("2010.04.30 08:00:00").getTime())
//endTime = new Timestamp(format.parse("2010.05.04 22:00:00").getTime())
startTime = new Timestamp(format.parse(args[1] + " 09:00:00").getTime());
endTime = new Timestamp(format.parse(args[2] + " 17:00:00").getTime());
step = 1000*60*60*8 // 8 hour
// Report generating script follows
def getMetricsFor(aInstance) {
def metrics = []
def windowStart = new Timestamp(startTime.getTime())
def windowStop = new Timestamp(startTime.getTime()+step)
metrics.add(getMetricsFor(aInstance, windowStart, windowStop))
windowStart.setTime(windowStop.getTime())
windowStop.setTime(windowStop.getTime()+step)
return metrics
}
def getMetricsFor(aInstance, windowStart, windowStop) {
def ds = server["DataService"]
def metric = []
metric.add(aInstance.get(parent_label))
metric.add(format.format(windowStart))
metric.add(format.format(windowStop))
metric_names.each{metric_name->
parentIndex = metric_name.lastIndexOf("/")
if (parentIndex >= 0) {
metricParent = aInstance.get(metric_name.substring(0, parentIndex))
metric_name = metric_name.substring(parentIndex+1)
}
else {
metricParent = aInstance
}
if (metricParent != null)
metric.add(ds.retrieveAggregate(metricParent, metric_name, windowStart, windowStop)?.getValue()?.getAvg())
}
return metric
}
////////////////////////
// get Data and Export
////////////////////////
def expMetrics = []
def instances = server.QueryService.queryTopologyObjects(metric_parent);
def origStart = new Timestamp(startTime.getTime())
instances.each{ _instance ->
while (startTime < endTime) {
expMetrics.addAll(getMetricsFor(_instance))
startTime = startTime.plus(1) // add one day
}
startTime = new Timestamp(origStart.getTime())
}
expMetrics.each{m->
int i = 0;
m.each{k->
output.append((i>0?",":"")+k)
i++
}
output.append("\n")
}
return output
For every host, generate the current Total disk space available together with the space available for every monitored disk on that host
Example output:
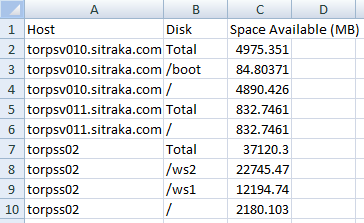
exportHostSpaceAvailable.groovy
// This script comes with no support, expressed or implied.

import java.sql.Timestamp
import java.text.SimpleDateFormat

////////////////////
// Please change this to your needs
/////////////////////
// Topology Query
def metric_query = "Host where name like 'tor%'"
//def metric_query = "Host"
column_titles = "Host,Disk,Space Available (MB)"

def getMetricsFor(aHost) {
          def metrics = []
          results = getSpaceMetricsFor(aHost, metrics)
          return metrics
}

def getSpaceMetricsFor(aHost, metrics) {
          def ds = server["DataService"]
          def metric = []
          storage = aHost.get("storage")
          if (storage == null) return
          hostname = aHost.get("name")
          metric.add(hostname)
          metric.add("Total")

          metric.add(ds.retrieveLatestValue(storage, "spaceAvailable").getValue().getMin())
          metrics.add(metric)
          disks = storage.get("logicalDisks")
          if (disks != null) {
                    disks.each{ _disk->
                              spaceAvailable = ds.retrieveLatestValue(_disk, "spaceAvailable")
                              if (spaceAvailable != null) {
                                   metric = []
                                   metric.add(hostname)
                                   metric.add(_disk.get("name"))
                                   metric.add(spaceAvailable.getValue().getMin());
                                   metrics.add(metric)
                              }
                    }
          }
}

////////////////////////
// get Data and Export
////////////////////////
def expMetrics = []
def hosts = server.get("QueryService").queryTopologyObjects(metric_query);
hosts.each{ _host->
           expMetrics.addAll(getMetricsFor(_host))

}

// Build Result
StringBuffer buffer = new StringBuffer();
buffer.append(column_titles+"\n");
expMetrics.each{m->
          int i = 0;
          m.each{k->
          buffer.append((i>0?",":"")+k)
          i++ }
          buffer.append("\n")
}
return buffer
Foglight Administration: List of Foglight Users and their Groups
Example output:
Last login: 1 days ago
Groups:
[DG] Foglight Users
[DG] Cartridge Developers
[DG] Foglight Security Administrators
[DG] DbOnly
[DG] Foglight Administrators
User: jcurrier
Last login: 15 days ago
Groups:
[DG] Foglight Operators
[DG] Foglight Users
[DG] Cartridge Developers
[DG] Foglight Administrators
User: DbUser
Last login: 296 days ago
Groups:
[DG] Foglight Users
[DG] DbOnly
User: shealy
Last login: never
Groups:
[DG] Foglight Operators
[DG] Cartridge Developers
[DG] Foglight Administrators
This output was generated by:
getUsersAndGroups.groovy
// This script comes with no support, expressed or implied.
// A script to list all Foglight users and their groups

def secSvc = server["SecurityService"]
def allUsers = secSvc.findAllUsers()
def result = new StringBuilder()

def output(result, secUser, directGroups, parentGroups) {
// print the output
def lineSep = "\n"
def fillerD = "[DG] "
def fillerP = "[PG] "
def today = new Date()

result.append(lineSep + "User: ${secUser.name}" + lineSep)

lastLogon =  secUser.getLastLogonTS()
logonTime = (lastLogon.getTime() < 40000000000) ? "never" :  '' + (today - lastLogon) + " days ago"
result.append("Last login: " + logonTime +  lineSep)

result.append("Groups: " + lineSep)
directGroups.each { g ->
if (g != null) result.append(fillerD + g.name + "\n")
}
parentGroups.each { g ->
if (g != null) result.append(fillerP + g.name + "\n")
}
}

allUsers.each { u ->
def secUser = secSvc.findUserById(u.id)

// find those groups that are directly assigned to the user
def directGroups = secUser.getSecGroups()

// find the parent groups of those directly assigned groups
def maxGroupNestingLevels = 15
def parentGroupIds = []
if (directGroups.size() > 0) {
parentGroupIds = secSvc.getAllParentGroupIds(directGroups, maxGroupNestingLevels)
}
def parentGroups = parentGroupIds.collect { secSvc.findGroupById(it) }
output(result, secUser, directGroups, parentGroups)
}

return result.toString()
Foglight Administration: List all Foglight Agent Managers and associated Agent by Host
Example output:
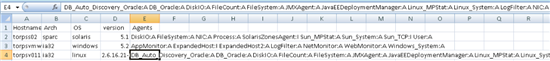
The output is a .csv report with one line per FglAM (Foglight Agent Manager). The columns are Hostname, Arch, OS, version, Agents.
The Agents cell has a list of all agents on that FglAM with an indication of whether the agent is active or not (":A" or ":I").
The script can be run like:
C:\Quest_Software\Foglight\bin\fglcmd.bat -srv fmshost.acme.com -port 8080 -usr foglight -pwd f&gL!ght2 -cmd script:run -f agentReport.groovy > agent_report.csv
agentReport.groovy
// This script comes with no support, expressed or implied.
agentService = server.get("AgentService");
managerService = server.get("RemoteAgentManagementService");
agents = agentService.findAll();
clients = managerService.findAllRemoteClients();
clients.sort({it.getHostName()});
output = 'Hostname, Arch, OS, version, Agents\n'
clients.each() {client ->
// basic information about each fglam: hostname, hardware arch, OS name, OS version
output += client.getHostName() + ',' + client.getArchitecture() + ',' + client.getOSName() + ',' + client.getOSVersion() +','
// get all agents associated with this fglam, sort by the agent type
clientagents = agents.findAll{it.getRemoteClientId() == client.getId() }
clientagents.sort{it.getTypeId()}
// for each agent, write the name and whether it is active or not (:A or :I)
clientagents.each{agent->
output += agent.getTypeId() + (agent.getIsActive()?':A':':I') + ' '
}
output += '\n'
}
return output
If you have a useful scripted report or use the examples on this page to create a new interesting report, please post a comment below.
Happy reporting!